
Concept explainers
Videos
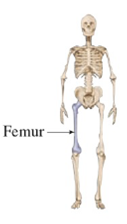
Femur Length and Height Anthropologists use a linear model that relates femur length to height. The model allows an anthropologist to determine the height of an individual when only a partial skeleton (including the femur) is found. In this problem we find the model by analyzing the data on femur length and height for the eight males given in the table.
(a) Make a
(b) Find and graph a linear function that models the data.
(c) An anthropologist finds a femur of length
 |
|
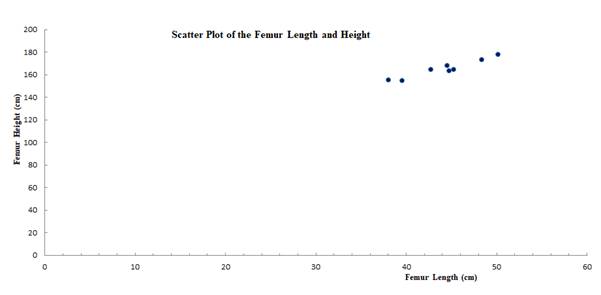
(a)
To make:
A scatter plot of the data given below:
| Femur length (cm) |
Height (cm) |
| 50.1 | 178.5 |
| 48.3 | 173.6 |
| 45.2 | 164.8 |
| 44.7 | 163.7 |
| 44.5 | 168.3 |
| 42.7 | 165.0 |
| 39.5 | 155.4 |
| 38.0 | 155.8 |
Answer to Problem 1P
Solution:
Explanation of Solution
Approach:
A mathematical model is a mathematical representation of an equation or process. Mathematical models are used to predict or estimate the required output.
Scatter plots are the two dimensional graph that represent the coordinate values of the plotted points.
Calculation:
Given:
| Femur length (cm) |
Height (cm) |
| 50.1 | 178.5 |
| 48.3 | 173.6 |
| 45.2 | 164.8 |
| 44.7 | 163.7 |
| 44.5 | 168.3 |
| 42.7 | 165.0 |
| 39.5 | 155.4 |
| 38.0 | 155.8 |
Taking the femur length as

(b)
To find:
The linear function that models the data and graph the function of the scatter plot.
Answer to Problem 1P
Solution:
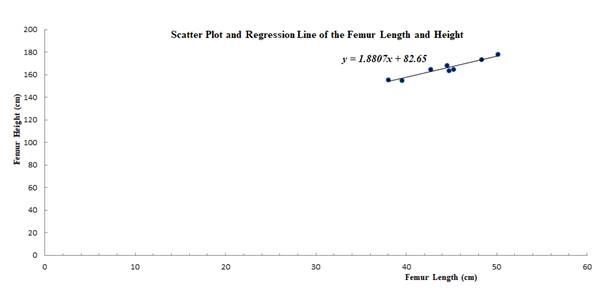
The linear function of the data is found as
Explanation of Solution
Approach:
A mathematical model is a mathematical representation of an equation or process. Mathematical models are used to predict or estimate the required output.
Scatter plots are the two dimensional graph that represent the coordinate values of the plotted points.
Calculation:
Given:
| Femur length (cm) |
Height (cm) |
| 50.1 | 178.5 |
| 48.3 | 173.6 |
| 45.2 | 164.8 |
| 44.7 | 163.7 |
| 44.5 | 168.3 |
| 42.7 | 165.0 |
| 39.5 | 155.4 |
| 38.0 | 155.8 |
The scatter plot and the graph of the linear function that models the data are plotted as shown below:

The linear function of the data is found as
(c)
To find:
The height of the femur of length
Answer to Problem 1P
Solution:
The height of the femur was
Explanation of Solution
Approach:
A mathematical model is a mathematical representation of an equation or process. Mathematical models are used to predict or estimate the required output.
Scatter plots are the two dimensional graph that represent the coordinate values of the plotted points.
Calculation:
From the data, we find that function is
Substituting the value of
Thus, the height of the femur was
Want to see more full solutions like this?
Chapter 1 Solutions
Algebra and Trigonometry (MindTap Course List)


 Trigonometry (MindTap Course List)TrigonometryISBN:9781337278461Author:Ron LarsonPublisher:Cengage Learning
 Algebra & Trigonometry with Analytic GeometryAlgebraISBN:9781133382119Author:SwokowskiPublisher:Cengage