
Videos
In each of Exercises C.47–C.53, we have presented a study conducted using two-way ANOVA and have displayed corresponding computer output that contains a two-way ANOVA table, cell and marginal
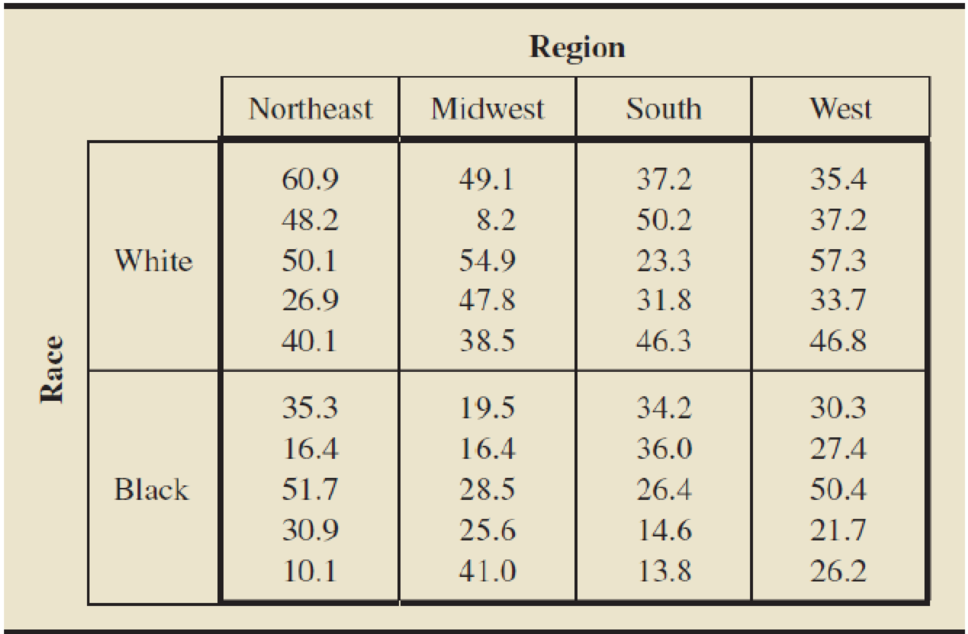
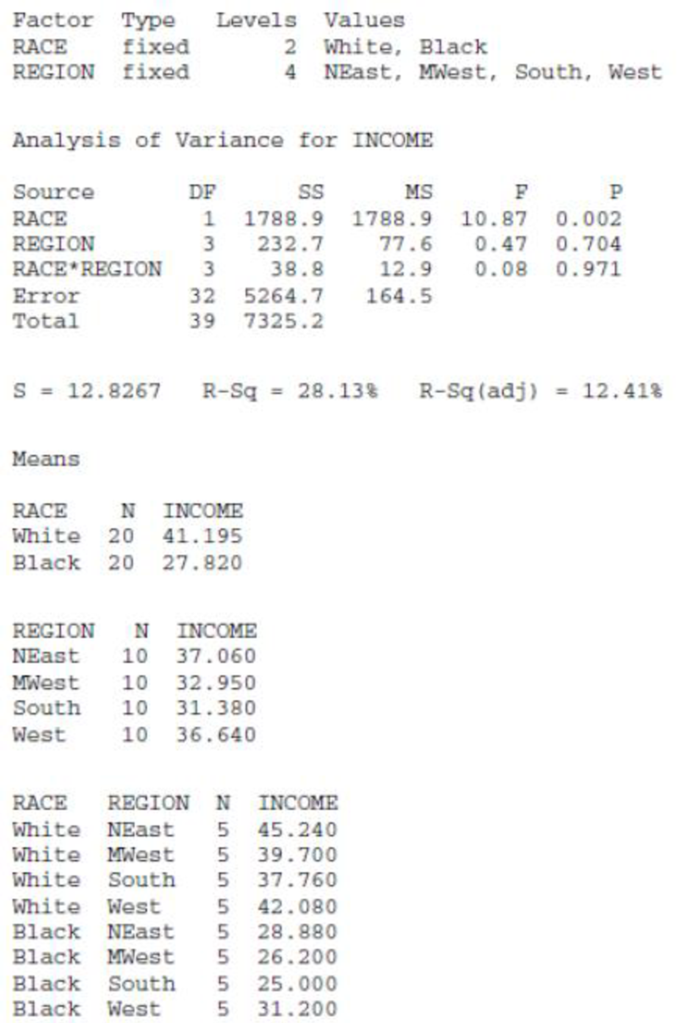
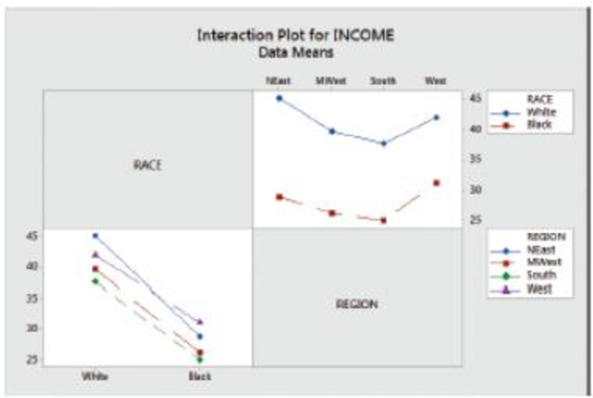
C.47 Household Income. The U.S. Bureau of the Census publishes data on money income of households by race and region in Current Population Reports. Independent samples of households yielded the following data on annual household income, in thousands of dollars. We performed a two-way ANOVA on the data. Output C.7 on page C-33 shows the resulting computer output and also supplies a table of cell and marginal means. Output C.8 on page C-33. shows the interaction plots.
OUTPUT C.7 ANOVA: INCOME versus RACE, REGION
Output for Exercise C.47 (and Exercise C.77)
OUTPUT C.8
Output for Exercise C.47
Want to see the full answer?
Check out a sample textbook solution
Chapter C Solutions
Introductory Statistics (10th Edition)


- What is meant by the sample space of an experiment?arrow_forwardWhat is an experiment?arrow_forwardOne critique of sentencing research is that it generally focuses on the differences between white defendants and defendants of color and rarely examines differences between minority groups. The JDCC data set can be used to test for differences between the sentences received by black and Hispanic juveniles convicted of property crimes. Black juveniles (Sample 1; N = 229) were sentenced to a mean of 31.09 months of probation (s = 15.42), and Hispanic juveniles (Sample 2; N = 118) received a mean of 40.84 months (s = 16.45). Using an alpha level of .01, test the hypothesis that there is a statistically significant difference between the two group means. Assume unequal population variances. Use all five steps.arrow_forward
- For a two-factor ANOVA with two levels of factor A, two levels of factor B, and a separate sample of n = 5 participants in each treatment condition, the two means for level A1 are 6 and 8, and the two means for level A2 are 6 and 10. For these data, what is the value of SSB?arrow_forwardOne sample is selected to represent scores in treatment 1 and a second sample is used to represent scores in treatment 2. Which set of sample statistics would present the clearest picture of a real difference between the two treatments? Group of answer choices M1 = 36; M2 = 40; and both variances =43 M1 = 38; M2 = 40; and both variances =43 M1 = 36; M2 = 40; and both variances =6 M1 = 38; M2 = 40; and both variances =6arrow_forwardFive samples of a ferrous-type substance were used to determine if there is a difference between a laboratory chemical analysis and an X-ray fluorescence analysis of the iron content. Each sample was split into two subsamples and the two types of analysis were applied, with the accompanying results. Assuming that the populations are normal, test at the 0.10 level of significance whether the two methods of analysis give, on the average, the same result.arrow_forward
- A researcher was interested in whether there were differences in the level of activity in children who had been diagnosed with ADHA depending on whether they had received no treatment, were on Ritalin, or were in a behavior management program. He recruited 90 children with ADHD to participate, and randomly assigned each child to one of the three groups. The number of classroom disturbances during a 1 hour period was measured for each child. Which statistical test would be best to determine if there is a significant difference between groups?arrow_forwardFor a two-factor ANOVA with two levels of factor A, two levels of factor B, and a separate sample of n = 8 participants in each treatment condition, the two means for level A1 are 3 and 5, and the two means for level A2 are 4 and 2. For these data, what is the value of SSbetween treatments?arrow_forwardA researcher was interested in whether there were differences in the level of activity in children who had been diagnosed with ADHA depending on whether they had received no treatment, were on Ritalin, or were in a behavior management program. He recruited 90 children with ADHD to participate, and randomly assigned each child to one of the three groups. The number of classroom disturbances during a 1 hour period was measured for each child. Which statistical test would be best to determine if there is a significant difference between groups? one-sample t-test dependent samples t-test independent samples t-test ANOVAarrow_forward
- A researcher was interested in whether there were differences in the level of activity in children who had been diagnosed with ADHA depending on whether they had received no treatment, were on Ritalin, or were in a behavior management program. He recruited 90 children with ADHD to participate, and randomly assigned each child to one of the three groups. The number of classroom disturbances during a 1 hour period was measured for each child. Which statistical test would be best to determine if there is a significant difference between groups? one-sample t-test dependent samples t-test ANOVAarrow_forwardCallahan (2009) conducted a study to evaluate the effectiveness of physical exercise programs for individuals with chronic arthritis. Participants with doctor-diagnosed arthritis either received a Tai Chi course immediately or were placed in a control group to begin the course 8 weeks later. At the end of the 8-week period, self-reports of pain were obtained for both groups. Data similar to the results obtained in the study are shown in the following table. Self-Reported Level of Pain Mean Mean SE Tai Chi course 3.7 1.2 No Tai Chi course 7.6 1.7 Construct a bar graph that…arrow_forwardZelazo et al. (1972) studied the variability in age at first walking in infants. 24 infants were randomly assigned to four groups of equal sample size (6 infants per group), with groups defined by method of reinforcement of walking: (1) active (2) passive (3) no exercise; and (4) 8 week control. The outcome variable measured was age at first walking, in months. The following table lists the study data, by group. Table - Study Data of Zelazo et al (1972), n=24: Active Group Passive Group 9.00 9.50 9.75 10.00 13.00 9.50 11.00 10.00 10.00 11.75 10.50 15.00 No-Exercise Group 11.50 12.00 Source: Zelazo et al (1972) "Walking" in the newborn. Science 176: 314-315. 9.00 11.50 13.25 13.00 8 Week Control 13.25 11.50 12.00 13.50 11.50 12.35 A- Find the mean and the standard deviation for each group B- Graph each group showing all groups in one chart.arrow_forward
 Glencoe Algebra 1, Student Edition, 9780079039897...AlgebraISBN:9780079039897Author:CarterPublisher:McGraw Hill
 College Algebra (MindTap Course List)AlgebraISBN:9781305652231Author:R. David Gustafson, Jeff HughesPublisher:Cengage Learning