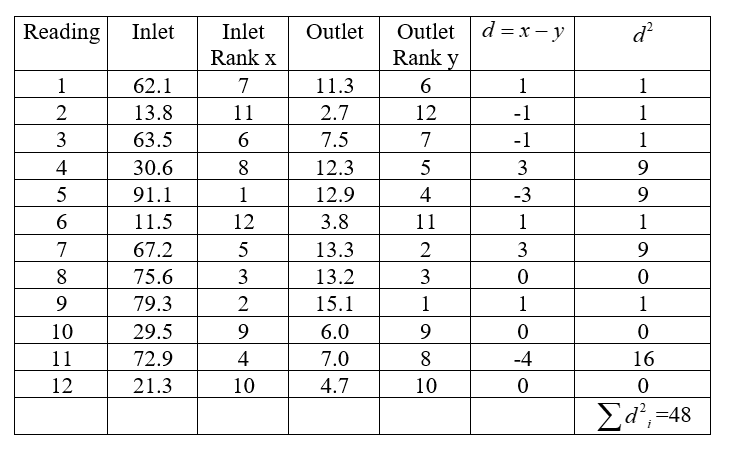
Turbid water is muddy or cloudy water. Sunlight is necessary for most life forms; thus turbid water is considered a threat to wetland ecosystems. Passive filtration systems are commonly used to reduce turbidity in wetlands. Suspended solids are measured in mg/l. Is there a relation between input and output turbidity for a passive filtration system and, if so, is it statistically significant? At a wetlands environment in Illinois, the inlet and outlet turbidity of a passive filtration system have been measured. A random sample of measurements are shown below. (Reference: EPA Wetland Case Studies.) Reading 1 2 3 4 5 6 7 8 9 10 11 12 Inlet (mg/l) 62.1 13.8 63.5 30.6 91.1 11.5 67.2 75.6 79.3 29.5 72.9 21.3 Outlet (mg/l) 11.3 2.7 7.5 12.3 12.9 3.8 13.3 13.2 15.1 6.0 7.0 4.7 Use a 1% level of significance to test the claim that there is a monotone relationship (either way) between the ranks of the inlet readings and outlet readings. (a) Rank-order the inlet readings using 1 as the largest data value. Also rank-order the outlet readings using 1 as the largest data value. Then construct a table of ranks to be used for a Spearman rank correlation test. Reading Inlet Rank x Oulet Rank y d = x - y d2 1 2 3 4 5 6 7 8 9 10 11 12 Σd2 = (b) What is the level of significance? (c) Compute the sample test statistic. (Use 3 decimal places.)


Addition Rule of Probability
It simply refers to the likelihood of an event taking place whenever the occurrence of an event is uncertain. The probability of a single event can be calculated by dividing the number of successful trials of that event by the total number of trials.
Expected Value
When a large number of trials are performed for any random variable ‘X’, the predicted result is most likely the mean of all the outcomes for the random variable and it is known as expected value also known as expectation. The expected value, also known as the expectation, is denoted by: E(X).
Probability Distributions
Understanding probability is necessary to know the probability distributions. In statistics, probability is how the uncertainty of an event is measured. This event can be anything. The most common examples include tossing a coin, rolling a die, or choosing a card. Each of these events has multiple possibilities. Every such possibility is measured with the help of probability. To be more precise, the probability is used for calculating the occurrence of events that may or may not happen. Probability does not give sure results. Unless the probability of any event is 1, the different outcomes may or may not happen in real life, regardless of how less or how more their probability is.
Basic Probability
The simple definition of probability it is a chance of the occurrence of an event. It is defined in numerical form and the probability value is between 0 to 1. The probability value 0 indicates that there is no chance of that event occurring and the probability value 1 indicates that the event will occur. Sum of the probability value must be 1. The probability value is never a negative number. If it happens, then recheck the calculation.
Turbid water is muddy or cloudy water. Sunlight is necessary for most life forms; thus turbid water is considered a threat to wetland ecosystems. Passive filtration systems are commonly used to reduce turbidity in wetlands. Suspended solids are measured in mg/l. Is there a relation between input and output turbidity for a passive filtration system and, if so, is it statistically significant? At a wetlands environment in Illinois, the inlet and outlet turbidity of a passive filtration system have been measured. A random sample of measurements are shown below. (Reference: EPA Wetland Case Studies.)
| Reading | 1 | 2 | 3 | 4 | 5 | 6 | 7 | 8 | 9 | 10 | 11 | 12 |
| Inlet (mg/l) | 62.1 | 13.8 | 63.5 | 30.6 | 91.1 | 11.5 | 67.2 | 75.6 | 79.3 | 29.5 | 72.9 | 21.3 |
| Outlet (mg/l) | 11.3 | 2.7 | 7.5 | 12.3 | 12.9 | 3.8 | 13.3 | 13.2 | 15.1 | 6.0 | 7.0 | 4.7 |
Use a 1% level of significance to test the claim that there is a monotone relationship (either way) between the ranks of the inlet readings and outlet readings.
| Reading | Inlet Rank x |
Oulet Rank y |
d = x - y | d2 |
| 1 2 3 4 5 6 7 8 9 10 11 12 |
Σd2 = |
(b) What is the level of significance?
The table of ranks is obtained as given below:
b). The level of significance is α=0.01
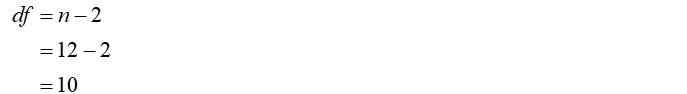
The degrees of freedom is obtained as

Step by step
Solved in 2 steps with 5 images


