
Statistics for Business & Economics, Revised (MindTap Course List)
12th Edition
ISBN: 9781285846323
Author: David R. Anderson, Dennis J. Sweeney, Thomas A. Williams, Jeffrey D. Camm, James J. Cochran
Publisher: South-Western College Pub
expand_more
expand_more
format_list_bulleted
Videos
Textbook Question
Chapter 17.4, Problem 17E
Consider the following time series data.
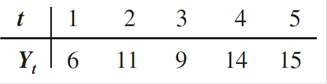
- a. Construct a time series plot. What type of pattern exists in the data?
- b. Develop the linear trend equation for this time series.
- c. What is the forecast for t = 6?
Expert Solution & Answer

Trending nowThis is a popular solution!

Students have asked these similar questions
consider the following time series data.t 1 2 3 4 5 6 7yt10 9 7 8 6 4 4a. construct a time series plot. What type of pattern exists in the data?b. develop the linear trend equation for this time series.c. What is the forecast for t = 8?
The time series pattern that exists when the data fluctuate around a constant mean is the ______________.
A. horizontal pattern.
B. seasonal pattern.
C. cyclical pattern.
D. trend pattern.
the costello Music company has been in business for five years. during that time, salesof pianos increased from 12 units in the first year to 76 units in the most recent year. Fredcostello, the firm’s owner, wants to develop a forecast of piano sales for the coming year.the historical data follow.Year 1 2 3 4 5Sales 12 28 34 50 76a. construct a time series plot. What type of pattern exists in the data?b. develop the linear trend equation for the time series. What is the average increase insales that the firm has been realizing per year?c. Forecast sales for years 6 and 7.
Chapter 17 Solutions
Statistics for Business & Economics, Revised (MindTap Course List)
Ch. 17.2 - Consider the following time series data. Week 1 2...Ch. 17.2 - Refer to the time series data in exercise 1. Using...Ch. 17.2 - Exercises 1 and 2 used different forecasting...Ch. 17.2 - Consider the following time series data. Month 1 2...Ch. 17.3 - Consider the following time series data. Week 1 2...Ch. 17.3 - Consider the following time series data. Month 1 2...Ch. 17.3 - Refer to the gasoline sales time series data in...Ch. 17.3 - Refer again to the gasoline sales time series data...Ch. 17.3 - With the gasoline time series data from Table...Ch. 17.3 - With a smoothing constant of = .2, equation...
Ch. 17.3 - For the Hawkins Company, the monthly percentages...Ch. 17.3 - Corporate triple-A bond interest rates for 12...Ch. 17.3 - The values of Alabama building contracts (in ...Ch. 17.3 - The following time series shows the sales of a...Ch. 17.3 - Ten weeks of data on the Commodity Futures Index...Ch. 17.3 - The U.S. Census Bureau tracks the median price for...Ch. 17.4 - Consider the following time series data. a....Ch. 17.4 - Prob. 18ECh. 17.4 - Consider the following time series. a. Construct a...Ch. 17.4 - Prob. 20ECh. 17.4 - Prob. 21ECh. 17.4 - Prob. 22ECh. 17.4 - The president of a small manufacturing firm is...Ch. 17.4 - FRED (Federal Reserve Economic Data), a database...Ch. 17.4 - Automobile unit sales at B. J. Scott Motors, Inc.,...Ch. 17.4 - Giovanni Food Products produces and sells frozen...Ch. 17.4 - Prob. 27ECh. 17.5 - Consider the following time series. a. Construct a...Ch. 17.5 - Consider the following time series data. a....Ch. 17.5 - The quarterly sales data (number of copies sold)...Ch. 17.5 - Air pollution control specialists in southern...Ch. 17.5 - South Shore Construction builds permanent docks...Ch. 17.5 - Prob. 33ECh. 17.5 - Three years of monthly lawn-maintenance expenses...Ch. 17.6 - Consider the following time series data. a....Ch. 17.6 - Refer to exercise 35. a. Deseasonalize the time...Ch. 17.6 - The quarterly sales data (number of copies sold)...Ch. 17.6 - Three years of monthly lawn-maintenance expenses...Ch. 17.6 - Air pollution control specialists in southern...Ch. 17.6 - Electric power consumption is measured in...Ch. 17 - The weekly demand (in cases) for a particular...Ch. 17 - The following table reports the percentage of...Ch. 17 - United Dairies. Inc., supplies milk to several...Ch. 17 - Prob. 44SECh. 17 - Prob. 45SECh. 17 - The Mayfair Department Store in Davenport, Iowa,...Ch. 17 - Canton Supplies, Inc., is a service firm that...Ch. 17 - The Costello Music Company has been in business...Ch. 17 - Consider the Costello Music Company problem in...Ch. 17 - Refer to the Costello Music Company problem in...Ch. 17 - Refer to the Costello Music Company time series in...Ch. 17 - Hudson Marine has been an authorized dealer for CD...Ch. 17 - Refer to the Hudson Marine problem in exercise 52....Ch. 17 - Refer to the Hudson Marine problem in exercise 53....Ch. 17 - Refer to the Hudson Marine data in exercise 53. a....Ch. 17 - Forecasting Food and Beverage Sales The Vintage...Ch. 17 - Forecasting Lost Sales The Carlson Department...
Knowledge Booster


Learn more about
Need a deep-dive on the concept behind this application? Look no further. Learn more about this topic, statistics and related others by exploring similar questions and additional content below.Similar questions
- The US. import of wine (in hectoliters) for several years is given in Table 5. Determine whether the trend appearslinear. Ifso, and assuming the trend continues, in what year will imports exceed 12,000 hectoliters?arrow_forwardEXERCISES The following table gives the life expectancy at birth of females born in the United States in various years from 1970 to 2010. Source: National Center for Health Statistics. Year of Birth Life Expectancy years 1970 74.7 1975 76.6 1980 77.4 1985 78.2 1990 78.8 1995 78.9 2000 79.3 2005 79.9 2010 81.0 Find the life expectancy predicted by your regression equation for each year in the table, and subtract it from the actual value in the second column. This gives you a table of residuals. Plot your residuals as points on a graph.arrow_forwardConsider the time series data in the table below (a-c all count as one problem) a. Construct a time series plot. What type of pattern exists in the data?b. Develop a three-week moving average for this time series. Compute MSEand a forecast for week 8. c. Use α = 0.2 to compute the exponential smoothing value for the time series.Compute MSE and a forecast for week 8.arrow_forward
- Consider the following time series data.Quarter Year 1 Year 2 Year 31 4 6 72 2 3 63 3 5 64 5 7 8a. Construct a time series plot. What type of pattern exists in the data?b. Show the four-quarter and centered moving average values for this time series.c. Compute seasonal indexes and adjusted seasonal indexes for the four quarters.arrow_forwardUsing excel. For the Hawkins Company, the monthly percentages of all shipments received on time over the past 12 months are 80, 82, 84, 83, 83, 84, 85, 84, 82, 83, 84, and 83. a. Construct a time series plot. What type of pattern exists in the data? b. Compare the three-month moving average approach with the exponential smoothing approach for α=\alpha =α= .2. Which provides more accurate forecasts using MSE as the measure of forecast accuracy? c. What is the forecast for next month?arrow_forwardConsider the following time series data. Choose the correct time series plot. (i) (ii) (iii) (iv) What type of pattern exists in the data? Develop a three-week moving average for this time series. Compute MSE and a forecast for week 7. If required, round your answers to two decimal places. Week Time SeriesValue Forecast 1 18 2 13 3 16 4 11 fill in the blank 3 5 17 fill in the blank 4 6 14 fill in the blank 5 MSE: fill in the blank 6The forecast for week 7: fill in the blank 7 Use α = 0.2 to compute the exponential smoothing values for the time series. Compute MSE and a forecast for week 7. If required, round your answers to two decimal places. Week Time SeriesValue Forecast 1 18 2 13 fill in the blank 8 3 16 fill in the blank 9 4 11 fill in the blank 10 5 17 fill in the blank 11 6 14 fill in the blank 12 MSE: fill in the blank 13The forecast for week 7: fill in the blank 14 Compare the three-week moving average…arrow_forward
- Consider the following time series data. Choose the correct time series plot. (i) (ii) (iii) (iv) Plot (ii) What type of pattern exists in the data?Horizontal Pattern Develop a three-week moving average for this time series. Compute MSE and a forecast for week 7. If required, round your answers to two decimal places. Week Time SeriesValue Forecast 1 18 2 13 3 16 4 11 fill in the blank 3 5 17 fill in the blank 4 6 14 fill in the blank 5 MSE: fill in the blank 6The forecast for week 7: fill in the blank 7 Use α = 0.2 to compute the exponential smoothing values for the time series. Compute MSE and a forecast for week 7. If required, round your answers to two decimal places. Week Time SeriesValue Forecast 1 18 2 13 fill in the blank 8 3 16 fill in the blank 9 4 11 fill in the blank 10 5 17 fill in the blank 11 6 14 fill in the blank 12 MSE: fill in the blank 13The forecast for week 7: fill in the blank 14arrow_forwardConsider the following time series data. Week 1 2 3 4 5 6 Value 18 13 16 11 17 14 Construct a time series plot. What type of pattern exist in the data? Develop a three-week moving average for this time series. Compute MSE and forecast for week 7. Use a = 0.2 to compute the exponential smoothing values for the time series. Compute MSE and forecast for week 7.arrow_forwardConsider the following time series data. Quarter Year 1 1 De- 2 3 4 3 1 4 6 Year 2 quarter 3 forecast quarter 4 forecast 5 2 6 8 Year 3 6 5 7 (a) Construct a time series plot. What type of pattern exists in the data? O The time series plot shows a horizontal pattern and no seasonal pattern in the data. The time series plot shows a linear trend and no seasonal pattern in the data. O The time series plot shows a linear trend and a seasonal pattern in the data. O The time series plot shows a horizontal pattern, but there is also a seasonal pattern in the data. 9 (b) Use a multiple regression model with dummy variables as follows to develop an equation to account for seasonal effects in the data. (Round your numerical values to three decimal places.) x₁ = 1 If quarter 1, 0 otherwise; x₂ = 1 If quarter 2, 0 otherwise; x₂ = 1 If quarter 3, 0 otherwise (c) Compute the quarterly forecasts for the next year based on the model you developed in part (b). (Round your answers to two decimal…arrow_forward
arrow_back_ios
arrow_forward_ios
Recommended textbooks for you
 Calculus For The Life SciencesCalculusISBN:9780321964038Author:GREENWELL, Raymond N., RITCHEY, Nathan P., Lial, Margaret L.Publisher:Pearson Addison Wesley,
 Glencoe Algebra 1, Student Edition, 9780079039897...AlgebraISBN:9780079039897Author:CarterPublisher:McGraw Hill
 Big Ideas Math A Bridge To Success Algebra 1: Stu...AlgebraISBN:9781680331141Author:HOUGHTON MIFFLIN HARCOURTPublisher:Houghton Mifflin Harcourt
 Trigonometry (MindTap Course List)TrigonometryISBN:9781305652224Author:Charles P. McKeague, Mark D. TurnerPublisher:Cengage Learning
Calculus For The Life Sciences
Calculus
ISBN:9780321964038
Author:GREENWELL, Raymond N., RITCHEY, Nathan P., Lial, Margaret L.
Publisher:Pearson Addison Wesley,
Glencoe Algebra 1, Student Edition, 9780079039897...
Algebra
ISBN:9780079039897
Author:Carter
Publisher:McGraw Hill
Big Ideas Math A Bridge To Success Algebra 1: Stu...
Algebra
ISBN:9781680331141
Author:HOUGHTON MIFFLIN HARCOURT
Publisher:Houghton Mifflin Harcourt
Trigonometry (MindTap Course List)
Trigonometry
ISBN:9781305652224
Author:Charles P. McKeague, Mark D. Turner
Publisher:Cengage Learning
Time Series Analysis Theory & Uni-variate Forecasting Techniques; Author: Analytics University;https://www.youtube.com/watch?v=_X5q9FYLGxM;License: Standard YouTube License, CC-BY
Operations management 101: Time-series, forecasting introduction; Author: Brandoz Foltz;https://www.youtube.com/watch?v=EaqZP36ool8;License: Standard YouTube License, CC-BY