
Videos
Reset the Data Section of the CAPBUD2 worksheet to the original values. In requirement 4, you assessed the sensitivity of the investment’s
- a. What annual cash flow (approximately) is required to:
- (1) earn 0% rate of return? _______________
- (2) earn 10% rate of return? _______________
- (3) earn over 20% rate of return? _______________
- b. Approximately, how much is the rate of return reduced for each drop of $10,000 annual cash flow?
When the assignment is complete, close the file without saving it again.
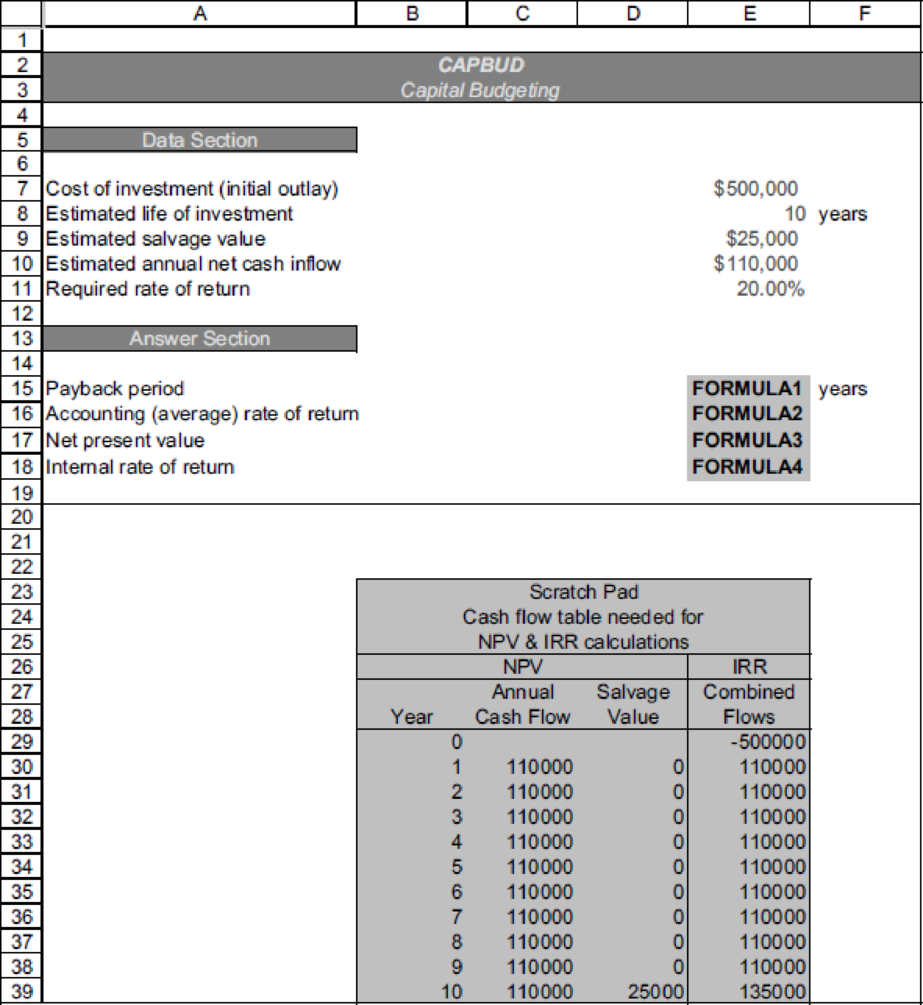
Worksheet. The CAPBUD2 worksheet handles only cash inflows that are even in amount each year. Many capital projects generate uneven cash inflows. Suppose that the new store had expected cash earnings of $80,000 per year for the first two years, $140,000 for the next four years, and $220,000 for the last four years. The new store will generate the same total cash return ($1,600,000) as in the original problem, but the timing of the cash flows is different. Alter the CAPBUD2 worksheet so that the NPV and IRR calculations can be made whether there are even or uneven cash flows. When done, preview the printout to make sure that the worksheet will print neatly on one page, and then print the worksheet. Save the completed file as CAPBUDT.
Hint: One suggestion is to label column F in the scratch pad as Uneven cash flows.
Enter the uneven cash flows for each year. Modify FORMULA3 to include these cash flows. Modify the formulas in the range E30 to E39 to include the new data. Then set cell E10 (estimated Annual Net
Note that this solution causes garbage to come out in cells E15 and E16 because those formulas were not altered. Check figure for uneven cash flows: NPV (cell E17), $68,674.
Chart. Using the CAPBUD2 file, develop a chart just like the one used in requirement 6 to show the sensitivity of
Want to see the full answer?
Check out a sample textbook solution
Chapter 26 Solutions
Excel Applications for Accounting Principles


- Use both the TVM equations and a financial calculator to find the following values. (Hint: If you are using a financial calculator, you can enter the known values and then press the appropriate key to find the unknown variable. Then, without clearing the TVM register, you can "override" the variable that changes by simply entering a new value for it and then pressing the key for the unknown variable to obtain the second answer. This procedure can be used in parts b and d, and in many other situations, to see how changes in input variables affect the output variable.) Do not round intermediate calculations. Round your answers to the nearest cent. a. An initial $500 compounded for 10 years at 3%. $ b. An initial $500 compounded for 10 years at 6%. S C. The present value of $500 due in 10 years at a 3% discount rate. S d. The present value of $500 due in 10 years at a 6% discount rate. $arrow_forwardUse both the TVM equations and a financial calculator to find the following values. (Hint: If you are using a financial calculator, you can enter the known values and then press the appropriate key to find the unknown variable. Then, without clearing the TVM register, you can "override" the variable that changes by simply entering a new value for it and then pressing the key for the unknown variable to obtain the second answer. This procedure can be used in parts b and d, and in many other situations, to see how changes in input variables affect the output variable.) Do not round intermediate calculations. Round your answers to the nearest cent. An initial $400 compounded for 10 years at 5%. An initial $400 compounded for 10 years at 10%. The present value of $400 due in 10 years at a 5% discount rate. The present value of $400 due in 10 years at a 10% discount rate.arrow_forwardPresent and Future Values of Single Cash Flows for Different Periods Find the following values, using the equations, and then work the problems using a financial calculator to check your answers. Disregard rounding differences. (Hint: If you are using a financial calculator, you can enter the known values and then press the appropriate key to find the unknown variable. Then, without clearing the TVM register, you can "override" the variable that changes by simply entering a new value for it and then pressing the key for the unknown variable to obtain the second answer. This procedure can be used in parts b and d, and in many other situations, to see how changes in input variables affect the output variable.) Do not round intermediate calculations. Round your answers to the nearest cent. An initial $600 compounded for 1 year at 6%. $ An initial $600 compounded for 2 years at 6%. $ The present value of $600 due in 1 year at a discount rate of 6%. $ The present value of $600…arrow_forward
- nd the present value of the following ordinary annuities. (Notes: If you are using a financial calculator, you can enter the known values and then press the appropriate key to find the unknown variable. Then, without clearing the TVM register, you can "override" the variable that changes by simply entering a new value for it and then pressing the key for the unknown variable to obtain the second answer. This procedure can be used in many situations, to see how changes in input variables affect the output variable. Also, note that you can leave values in the TVM register, switch to Begin Mode, press PV, and find the PV of the annuity due.) Do not round intermediate calculations. Round your answers to the nearest cent. $600 per year for 10 years at 12%. $ $300 per year for 5 years at 6%. $ $600 per year for 5 years at 0%. $ Now rework parts a, b, and c assuming that payments are made at the beginning of each year; that is, they are annuities due. Present value of $600…arrow_forwardExplain how Monte Carlo simulation can be used to help set afirm’s target cash balance.arrow_forwardDirection: Solve what is being asked and show your complete and neat solution. (ROUND OF PV FACTORS TO 4 DECIMAL PLACES, ROUND OF FINAL ANSWER TO TWO DECIMAL PLACES. IN MCQs CHOOSE THE BEST ANSWER) D.) The frequency of spending or the rate or turnover of money a. Demand for money b. Velocity of money c. Transaction demand d. Speculative demand E.) Is a contractual financial product sold by financial institutions that is designed to accept and grow funds from an individual and then, upon annuitization, pay out a stream of payments to the individual at a later point in time. a. Annuity b. Demand c. Speculation d. Investmentarrow_forward
- In a single sentence, explain how you can determine which cash flows should be included in the analysis of a project. For the toolbar, press ALT+F10 (PC) or ALT+FN+F10 (Mac).arrow_forwardAll parts are under one questions and per your policy therefore all parts can be answered. 1. Concepts used in cash flow estimation and risk analysis You can come across different situations in your life where the concepts from capital budgeting will help you in evaluating the situation and making calculated decisions. Consider the following situation: The following table contains five definitions or concepts. Identify the term that best corresponds to the concept or definition given. A. Concept or Definition Term A computer-generated probability simulation of the most likely outcome, given a set of probable future events The most likely scenario in a capital budgeting analysis A measure of the project’s effect on the firm’s earnings variability A method to determine market risk by using the betas of single-product companies in a given industry The risk that is measured by the project’s beta coefficient B. Marston…arrow_forwardPlease slove the question shown in the image. Calculating the rate of return on investment. Please show basic steps of how you derived the answer.arrow_forward
- this is an IFRS cash flow statement, please find all the error inside the statement. thanksarrow_forwardAdd cash flow diagram and answer correctly. I will rate and review.arrow_forwardWhich of the following procedures does the text say is used most frequently by businesses when they do capital budgeting analyses? a. Monte Carlo simulation uses a computer to generate random sets of inputs, those inputs are then used to determine a trial NPV, and a number of trial NPVs are averaged to find the project's expected NPV. Sensitivity and scenario analyses, on the other hand, require much more information regarding the input variables, including probability distributions and correlations among those variables. This makes it easier to implement a simulation analysis than a scenario or sensitivity analysis, hence simulation is the most frequently used procedure. b. Differential project risk cannot be accounted for by using "risk-adjusted discount rates" because it is highly subjective and difficult to justify. It is better to not risk adjust at all. c. The firm's corporate, or overall, WACC is used to discount all project cash flows to…arrow_forward
 Excel Applications for Accounting PrinciplesAccountingISBN:9781111581565Author:Gaylord N. SmithPublisher:Cengage Learning