
Videos
Value Chain Analysis and Financial Statement Relations. Exhibit 1.25 (page 68) presents common-size income statements and balance sheets for seven firms that operate at various stages in the value chain for the pharmaceutical industry. These common-size statements express all amounts as a percentage of sales revenue. Exhibit 1.25 also shows the cash flow from operations to capital expenditures ratios for each firm. A dash for a particular financial statement item does not necessarily mean the amount is zero. It merely indicates that the amount is not sufficiently large for the firm to disclose it. A list of the seven companies and a brief description of their activities follow.
- A. Wyeth: Engages in the development, manufacture, and sale of ethical drugs (that is, drugs requiring a prescription). Wyeth’s drugs represent primarily mixtures of chemical compounds. Ethical-drug companies must obtain approval of new drugs from the U.S. Food and Drug Administration (FDA). Patents protect such drugs from competition until other drug companies develop more effective substitutes or the patent expires.
- B. Amgen: Engages in the development, manufacture, and sale of drugs based on biotechnology research. Biotechnology drugs must obtain approval from the FDA and enjoy patent protection similar to that for chemical-based drugs. The biotechnology segment is less mature than the ethical-drug industry, with relatively few products having received FDA approval.
- C. Mylan Laboratories: Engages in the development, manufacture, and sale of generic drugs. Generic drugs have the same chemical compositions as drugs that had previously benefited from patent protection but for which the patent has expired. Generic-drug companies have benefited in recent years from the patent expiration of several major ethical drugs. However, the major ethical-drug companies have increasingly offered generic versions of their ethical drugs to compete against the generic-drug companies.
- D. Johnson & Johnson: Engages in the development, manufacture, and sale of over-thecounter health care products. Such products do not require a prescription and often benefit from brand recognition.
- E. Covance: Offers product development and laboratory testing services for biotechnology and pharmaceutical drugs. It also offers commercialization
services and market access services. Cost of goods sold for this company represents the salaries of personnel conducting the laboratory testing and drug approval services. - F. Cardinal Health: Distributes drugs as a wholesaler to drugstores, hospitals, and mass erchandisers. Also offers pharmaceutical benefit management services in which it provides customized databases designed to help customers order more efficiently, contain costs, and monitor their purchases. Cost of goods sold for Cardinal Health includes the cost of drugs sold plus the salaries of personnel providing pharmaceutical benefit management services.
- G. Walgreens: Operates a chain of drugstores nationwide. The data in Exhibit 1.25 for Walgreens include the recognition of operating lease commitments for retail space.
REQUIRED
Use the ratios to match the companies in Exhibit 1.25 with the firms listed above.

Trending nowThis is a popular solution!

Chapter 1 Solutions
Financial Reporting, Financial Statement Analysis and Valuation


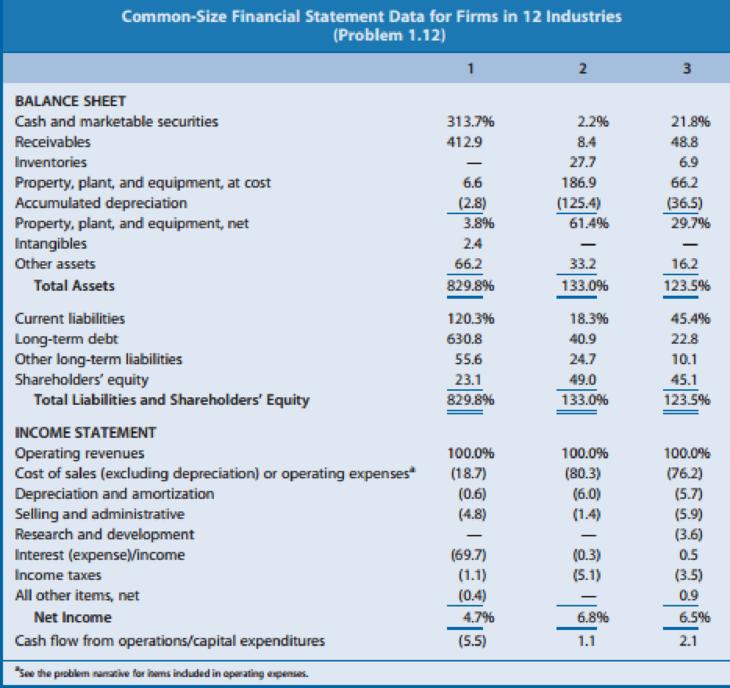
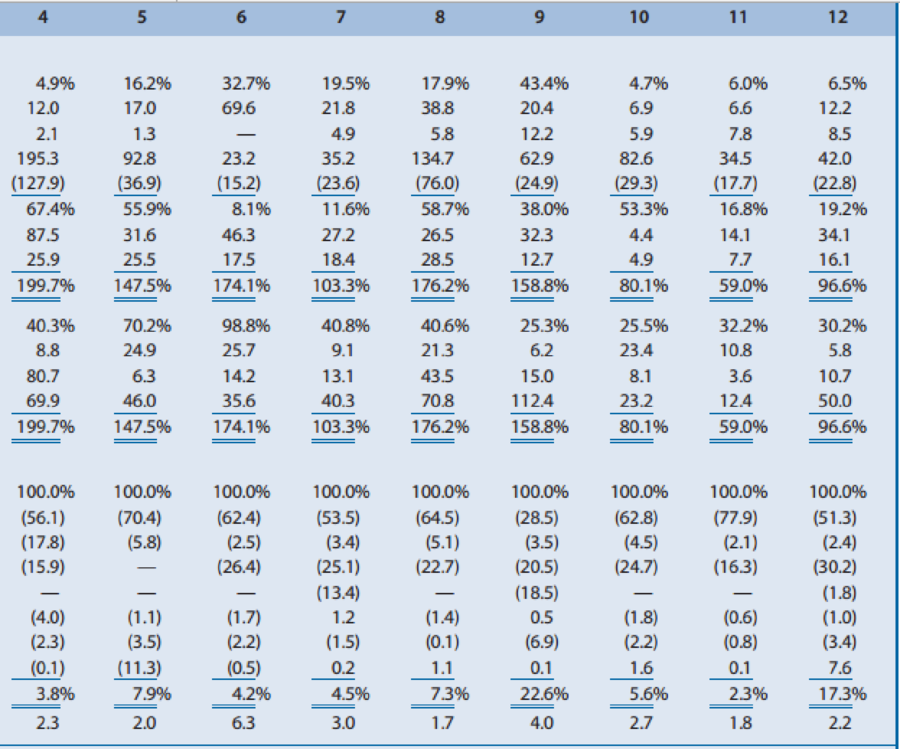
- Effect of Industry Characteristics on Financial Statement Relations. Effective financial statement analysis requires an understanding of a firms economic characteristics. The relations between various financial statement items provide evidence of many of these economic characteristics. Exhibit 1.22 (pages 6061) presents common-size condensed balance sheets and income statements for 12 firms in different industries. These common-size balance sheets and income statements express various items as a percentage of operating revenues. (That is, the statement divides all amounts by operating revenues for the year.) Exhibit 1.22 also shows the ratio of cash flow from operations to capital expenditures. A dash for a particular financial statement item does not necessarily mean the amount is zero. It merely indicates that the amount is not sufficiently large enough for the firm to disclose it. Amounts that are not meaningful are shown as n.m. A list of the 12 companies and a brief description of their activities follow. A. Amazon.com: Operates websites to sell a wide variety of products online. The firm operated at a net loss in all years prior to that reported in Exhibit 1.22. B. Carnival Corporation: Owns and operates cruise ships. C. Cisco Systems: Manufactures and sells computer networking and communications products. D. Citigroup: Offers a wide range of financial services in the commercial banking, insurance, and securities business. Operating expenses represent the compensation of employees. E. eBay: Operates an online trading platform for buyers to purchase and sellers to sell a variety of goods. The firm has grown in part by acquiring other companies to enhance or support its online trading platform. F. Goldman Sachs: Offers brokerage and investment banking services. Operating expenses represent the compensation of employees. G. Johnson Johnson: Develops, manufactures, and sells pharmaceutical products, medical equipment, and branded over-the-counter consumer personal care products. H. Kelloggs: Manufactures and distributes cereal and other food products. The firm acquired other branded food companies in recent years. I. MGM Mirage: Owns and operates hotels, casinos, and golf courses. J. Molson Coors: Manufactures and distributes beer. Molson Coors has made minority ownership investments in other beer manufacturers in recent years. K. Verizon: Maintains a telecommunications network and offers telecommunications services. Operating expenses represent the compensation of employees. Verizon has made minority investments in other cellular and wireless providers. L. Yum! Brands: Operates chains of name-brand restaurants, including Taco Bell, KFC, and Pizza Hut. REQUIRED Use the ratios to match the companies in Exhibit 1.22 with the firms listed above.arrow_forwardEffect of Industry Characteristics on Financial Statement Relations. Effective financial statement analysis requires an understanding of a firms economic characteristics. The relations between various financial statement items provide evidence of many of these economic characteristics. Exhibit 1.23 (pages 6263) presents common-size condensed balance sheets and income statements for 12 firms in different industries. These common-size balance sheets and income statements express various items as a percentage of operating revenues. (That is, the statement divides all amounts by operating revenues for the year.) Exhibit 1.23 also shows the ratio of cash flow from operations to capital expenditures. A dash for a particular financial statement item does not necessarily mean the amount is zero. It merely indicates that the amount is not sufficiently large for the firm to disclose it. A list of the 12 companies and a brief description of their activities follow. A. Abercrombie Fitch: Sells retail apparel primarily through stores to the fashionconscious young adult and has established itself as a trendy, popular player in the specialty retailing apparel industry. B. Allstate Insurance: Sells property and casualty insurance, primarily on buildings and automobiles. Operating revenues include insurance premiums from customers and revenues earned from investments made with cash received from customers before Allstate pays customers claims. Operating expenses include amounts actually paid or expected to be paid in the future on insurance coverage outstanding during the year. C. Best Buy: Operates a chain of retail stores selling consumer electronic and entertainment equipment at competitively low prices. D. E. I. du Pont de Nemours: Manufactures chemical and electronics products. E. Hewlett-Packard: Develops, manufactures, and sells computer hardware. The firm outsources manufacturing of many of its computer components. F. HSBC Finance: Lends money to consumers for periods ranging from several months to several years. Operating expenses include provisions for estimated uncollectible loans (bad debts expense). G. Kelly Services: Provides temporary office services to businesses and other firms. Operating revenues represent amounts billed to customers for temporary help services, and operating expenses include amounts paid to the temporary help employees of Kelly. H. McDonalds: Operates fast-food restaurants worldwide. A large percentage of McDonalds restaurants are owned and operated by franchisees. McDonalds frequently owns the restaurant buildings of franchisees and leases them to franchisees under long-term leases. I. Merck: A leading research-driven pharmaceutical products and services company. Merck discovers, develops, manufactures, and markets a broad range of products to improve human and animal health directly and through its joint ventures. J. Omnicom Group: Creates advertising copy for clients and is the largest marketing services firm in the world. Omnicom purchases advertising time and space from various media and sells it to clients. Operating revenues represent commissions and fees earned by creating advertising copy and selling media time and space. Operating expenses includes employee compensation. K. Pacific Gas Electric: Generates and sells power to customers in the western United States. L. Procter Gamble: Manufactures and markets a broad line of branded consumer products. REQUIRED Use the ratios to match the companies in Exhibit 1.23 with the firms listed above.arrow_forward- Please refer to the following Income Statement and Balance Sheet (see attached picture): Prepare a vertical analysis for both the income statement and balance sheet. Write a paragraph comparing the company’s performance with the industry average. Compute the following ratios and comment on what the results mean when evaluating the company: Current ratio Gross profit percentage ratio Debt ratio Profit margin ratioarrow_forward
- VII. Direction: Compute and interpret. The following comparative financial statements are provided by Avatar Industries. You were asked to compute the different financial ratios and provide your interpretations with regards to profitability, efficiency, liquidity and solvency of the company. Use the Answer Sheet template below to input your answer and solution. AVATAR INDUSTRIES AVATAR INDUSTRIES Comparative Statement of Financial Position For the years 2019 and 2018 Comparative Income Statement For the years 2019 and 2018 2019 2018 2019 2018 ASSETS Current Assets: Sales P200,000 P210,000 Cash & Cash Equivalent P65,000 P70,000 Sales Returns and Allowances 40,000 25,000 Accounts Receivable 40,000 35,000 Net Sales 160,000 185,000 Marketable Secuities 40,000 35,000 Cost of Goods Sold 100,000 115,625 Inventory 100,000 80,000 Gross Profit 60,000 69,375 Total Current Assets 220,000 200,000 160,000 P445,000 P380,000 245,000 Operating Expenses: Fixed Assets Selling Expenses 22,000 25,000 Total…arrow_forwardVII. Direction: Compute and interpret. The following comparative financial statements are provided by Avatar Industries. You were asked to compute the different financial ratios and provide your interpretations with regards to profitability, efficiency, liquidity and solvency of the company. Use the Answer Sheet template below to input your answer and solution. AVATAR INDUSTRIES AVATAR INDUSTRIES Comparative Statement of Financial Position For the years 2019 and 2018 Comparative Income Statement For the years 2019 and 2018 2019 2018 2019 2018 ASSETS Current Assets: Sales P200,000 P210,000 Cash & Cash Equivalent P65,000 P70,000 Sales Returns and Allowances 40,000 25,000 Accounts Receivable 40,000 35,000 Net Sales 160,000 185,000 Marketable Securities 40,000 35,000 Cost of Goods Sold 100,000 115,625 Inventory 100,000 80,000 Gross Profit 60,000 69,375 Total Current Assets 245,000 220,000 Operating Expenses: Fixed Assets 200,000 160,000 Selling Expenses 22,000 25,000 Total Assets P445,000…arrow_forwardSpecialty Department Stores chief executive officer (CEO) has asked you to compare the company's profit performance and financial position with the average for the industry. The CEO has given you the company's income statement and balance sheet, as well as the industry average data for retailers. Assets \table[[Current assets, %,.71.1%arrow_forward
- The DuPont equation shows the relationships among asset management, debt management, and ratios. Management can use the DuPont equation to analyze ways of improving the firm's performance. Its equation is: Ratio analysis is important to understand and interpret financial statements; however, sound financial analysis involves more than just calculating and interpreting numbers. factors also need to be considered. Quantitative Problem: Rosnan Industries' 2022 and 2021 balance sheets and income statements are shown below. Balance Sheets 2022 2021 Assets Cash and equivalents $ 70 $ 55 Accounts receivable 275 300 Inventories 375 350 Total current assets $ 720 $ 705 Net plant and equipment 2,000 1,490 Total assets $ 2,720 $ 2,195 Liabilities and Equity Accounts payable $ 150 $ 85 Accruals 75 50…arrow_forwardOne of the most important applications of ratio analysis is to compare a company’s performance with that of other players in the industry or to compare its own performance over a period of time. Such analyses are referred to as a comparative analysis and trend analysis, respectively. A) A common size analysis requires the representation of financial statement data relative to a single financial statement item (or base account or value). What is the most commonly used base item for a common size balance sheet? Net income Earnings before interest and taxes Total assets Net sales Suppose you are conducting an analysis of the financial performance of Blue Hamster Manufacturing Inc. over the past three years. The company did not issue new shares during these three years and has faced some operational difficulties. The company has thus pilot tested some new forecasting strategies for better operations management. You have collected the company’s relevant…arrow_forwardProfitability ratios: measure the amount of debt the firm uses. measure how effectively a firm is managing its assets. show the relationship of a firms cash and other current assets to its current liabilities. show the combined effects of all areas of the firm on operating results.arrow_forward
- Identify how each of the following transactions affects the company's financial statements. For the balance sheet, Identify how each transaction affects total assets, total llabilities, and equity. For the Income statement, Identify how each transaction affects profit. If there is an Increase, select a *+" In the column or columns. If there is a decrease, select a "-" In the column or columns. If there is both an Increase and a decrease, select a *+/-" In the column or columns. The Iline for the first transaction Is completed as an example. Income Statement Balance Sheet Total Total Transaction Equity Profit Assets Liabilities 1 Owner invests cash 2 Seli services for cash 3 Acquire services on credit 4 Pay wages with cash 5 Owner withdraws cash 6 Borrow cash with note payable 7 Sell services on credit 8 Buy office equipment for cash 9 Collect receivable from (7) 10 Buy asset with note payablearrow_forwardTRUE OR FALSE: Read each sentence carefully and determine whether the statement True or False. Write your answers in the space provided before the number. 1. Financial statement analysis uses computational and analytical techniques to evaluate the company's risks, performance, financial health, and future prospects with the objective of making economic decisions. 2. Return on asset is an operational efficiency ratio. 3. Profitability ratios measure the ability of the company's assets to generate sales. 4. Gross profit margin provides an indication of the company's average pricing policy 5. Given equal gross profit margin, the company with the lower operating income margin has higher operating expenses as a percentage of sales and has leaner operations. Written Works Below are the comparative Statement of Comprehensive Income & Statement of Financial Position of Ellane Company & Lanie Company: Statement of Comprehensive Income Ellane Company 2013 Melanie Company 2014 2013 2014 Net Sales…arrow_forwardWhich statement best describes a financial ratio and financial ratio analysis? A financial ratio simply represents a relationship between 2 or more pieces of financial information; there is one absolute, standard list of ratios that applies to all financial analysis A financial ratio simply represents a relationship between 2 or more pieces of financial information; there is NOT one absolute, standard list of ratios that applies to all financial analysis A financial ratio simply represents a market estimate of a certain aspect of a firm's financial position and the industry's benchmark; there is one absolute, standard list of ratios that applies to all financial analysis A financial ratio simply represents a market estimate of a certain aspect of a firm's financial position and the industry's benchmark; there is NOT one absolute, standard list of ratios that applies to all financial analysisarrow_forward
 Financial Reporting, Financial Statement Analysis...FinanceISBN:9781285190907Author:James M. Wahlen, Stephen P. Baginski, Mark BradshawPublisher:Cengage Learning