
To find: The best statement based on the given graph.
The option
Given information:
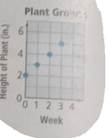
The graph that represents the growth rate of the plant is given below.
Calculations:
Based on the graph can understand that at beginning that is at the zero weeks plant growth was two inches, after one week plant growth is increased by two inches that is two added in each week number. Then the second week growth was two plus two that is four inches.
Thus at the fourth week plant growth will six inches and at the sixth week the plant growth inches will be eight inches.
So option
Chapter 1 Solutions
High School Math 2015 Common Core Algebra 2 Student Edition Grades 10/11

 Algebra and Trigonometry (6th Edition)AlgebraISBN:9780134463216Author:Robert F. BlitzerPublisher:PEARSON
 Contemporary Abstract AlgebraAlgebraISBN:9781305657960Author:Joseph GallianPublisher:Cengage Learning
 Linear Algebra: A Modern IntroductionAlgebraISBN:9781285463247Author:David PoolePublisher:Cengage Learning
 Algebra And Trigonometry (11th Edition)AlgebraISBN:9780135163078Author:Michael SullivanPublisher:PEARSON
 Introduction to Linear Algebra, Fifth EditionAlgebraISBN:9780980232776Author:Gilbert StrangPublisher:Wellesley-Cambridge Press
 College Algebra (Collegiate Math)AlgebraISBN:9780077836344Author:Julie Miller, Donna GerkenPublisher:McGraw-Hill Education