
Essentials of Business Analytics (MindTap Course List)
2nd Edition
ISBN: 9781305627734
Author: Jeffrey D. Camm, James J. Cochran, Michael J. Fry, Jeffrey W. Ohlmann, David R. Anderson
Publisher: Cengage Learning
expand_more
expand_more
format_list_bulleted
Concept explainers
Videos
Textbook Question
Chapter 15, Problem 4P
Investment advisors estimated the stock market returns for four market segments: computers, financial, manufacturing, and pharmaceuticals. Annual return projections vary depending on whether the general economic conditions are improving, stable, or declining. The anticipated annual return percentages for each market segment under each economic condition are as follows:
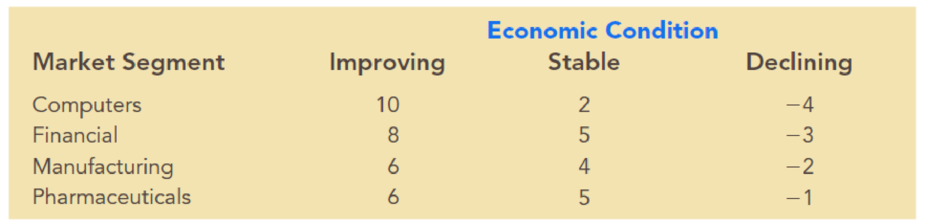
- a. Assume that an individual investor wants to select one market segment for a new investment. A forecast shows improving to declining economic conditions with the following probabilities: improving (0.2), stable (0.5), and declining (0.3). What is the preferred market segment for the investor, and what is the expected return percentage?
- b. At a later date, a revised forecast shows a potential for an improvement in economic conditions. New probabilities are as follows: improving (0.4), stable (0.4), and declining (0.2). What is the preferred market segment for the investor based on these new probabilities? What is the expected return percentage?
Expert Solution & Answer

Trending nowThis is a popular solution!

Students have asked these similar questions
A stock has monthly returns of 9%, 22%, 15%, and 28%. What is the stock's geometric average
return?
Filter Corp. has a project available with the following
cash flows:
Year Cash Flow
0
1
2
3
4
-$15,800
5,200
6,500
5,900
4,300
What is the project's IRR?
Multiple Choice
15.54%
14.92%
16.58%
17.40%
16.16%
You have $5000 to invest for 1 year. Fund A has an estimated 4% annual return, and Fund B has an
estimated 10% annual return.
Fund A is more stable, and preferred among investors with low risk tolerance. Fund B is less stable,
but has larger returns.
Answer the following questions about this investment opportunity.
Chapter 15 Solutions
Essentials of Business Analytics (MindTap Course List)
Ch. 15 - Prob. 1PCh. 15 - Southland Corporation’s decision to produce a new...Ch. 15 - Amy Lloyd is interested in leasing a new Honda and...Ch. 15 - Investment advisors estimated the stock market...Ch. 15 - Hudson Corporation is considering three options...Ch. 15 - Prob. 6PCh. 15 - Myrtle Air Express decided to offer direct service...Ch. 15 - Video Tech is considering marketing one of two new...Ch. 15 - Seneca Hill Winery recently purchased land for the...Ch. 15 - Hemmingway, Inc. is considering a $5 million...
Ch. 15 - The following profit payoff table was presented in...Ch. 15 - Suppose that you are given a decision situation...Ch. 15 - A firm has three investment alternatives. Payoffs...Ch. 15 - Alexander Industries is considering purchasing an...Ch. 15 - In a certain state lottery, a lottery ticket costs...Ch. 15 - Three decision makers have assessed utilities for...Ch. 15 - In Problem 22, if P(s1) = 0.25, P(s2) = 0.50, and...Ch. 15 - Translate the following monetary payoffs into...Ch. 15 - Consider a decision maker who is comfortable with...
Knowledge Booster


Learn more about
Need a deep-dive on the concept behind this application? Look no further. Learn more about this topic, statistics and related others by exploring similar questions and additional content below.Similar questions
- Duffin House, Higgins Press, and Sickle Publications all went public on the same day recently. John O'Hagan had the opportunity to participate in all three initial public offerings (partly because he and Marjory Duffin are good friends). He made a considerable profit when he sold all of the stock 2 days later on the open market. The following table shows the purchase price and percentage yield on the investment in each company. Purchase Priceper Share ($) Yield (%) Duffin House (DHS) 8 20 Higgins Press (HPR) 10 15 Sickle Publications (SPUB) 15 15 He invested $25,000 in a total of 2,600 shares and made a $4,350 profit from the transactions. How many shares in each company did he purchase? Duffin House shares Higgins Press shares Sickle Publications shares I have x+y+z=2600 8x+10y+15z=25,000 160x+150y+225z=435,000 i keep getting y=506, i know im doing something wrong :(arrow_forwardThe percentage of individual investors’ portfolios committed to stock depends on the state of the economy. As of April 2014, a typical portfolio consisted of cash (19%), stocks (30%), stock funds (37%), bonds (8%) and bond funds (6%). The following table reports the percentage of stocks in a typical portfolio in eight quarters of 2012 to 2013. Year Quarters Stock % 2012 1 29.8 2012 2 31 2012 3 29.9 2012 4 30.1 2013 1 32.2 2013 2 31.5 2013 3 32 2013 4 31.9 In the first quarter of 2013 the seasonal index of approximately………………. means that values of the time series are …………… by the presence of seasonal forces. A. 100.8416, depressed B. 96.8555, stimulated C. 99.1586, depressed D. 103.2465, stimulatedarrow_forwardMorning House is a mail-order firm which carries a wide range of rather expensive art objects for homes and offices. It operate problems would be greatly reduced. Since it takes approximately six weeks to receive 90% of the response to a given campaign, an accurate prediction of total sales made as late as the end of the first week of receiving orders would be useful. The first week’s sales and total sales of the last 12 campaigns of the firm are shown below. Can the first week’s sales be used to predict total sales? First week’s Total Campaign Sales Sales 1 32 167 2 20 91 3 114 560 4 66 335 5 18 70 6 125 650 7 83 401 8 65 320 9 94 470 10 5 15 11 39 210 12 50 265 --------------------------------------------arrow_forward
- An investor is concerned with the market return for the coming year, where the market return is defined as the percentage gain (or loss, if negative) over the year. The investor believes there are five possible scenarios for the national economy in the coming year: rapid expansion, moderate expansion, no growth, moderate contraction, and serious contraction. Furthermore, she has used all of the information available to her to estimate that the market returns for these scenarios are, respectively, 23%, 18%, 15%, 9%, and 3%. That is, the possible returns vary from a high of 23% to a low of 3%. Also, she has assessed that the probabilities of these outcomes are 0.12, 0.40, 0.25, 0.15, and 0.08. Use this information to describe the probability distribution of the market return. Compute the following for the probability distribution of the market return for the coming year.: 1. Mean, 2. Variance, 3. Standard deviation Show your solutions.arrow_forwardA survey of 131 investment managers in Barron’s Big Money poll revealed the following:● 43% of managers classified themselves as bullish or very bullish on the stockmarket.● The average expected return over the next 12 months for equities was 11.2%.● 21% selected health care as the sector most likely to lead the market in thenext 12 months.● When asked to estimate how long it would take for technology and telecom stocksto resume sustainable growth, the managers’ average response was 2.5 years.a. Cite two descriptive statistics.b. Make an inference about the population of all investment managers concerning theaverage return expected on equities over the next 12 months.c. Make an inference about the length of time it will take for technology and telecomstocks to resume sustainable growth.arrow_forwardThe Capital Asset Pricing Model (CAPM) is a financial model that assumes returns on a portfolio are normally distributed. Suppose a portfolio has an average annual return of 14.7% (i.e. an average gain of 14.7%) with a standard deviation of 33%. A return of 0% means the value of the portfolio doesn’t change, a negative return means that the portfolio loses money, and a positive return means that the portfolio gains money. What percent of years does this portfolio lose money, i.e. have a return less than 0%? What is the cutoff for the highest 15% of annual returns with this portfolio?arrow_forward
- The Capital Asset Pricing Model (CAPM) is a financial model that assumes returns on a portfolio are normally distributed. Suppose a portfolio has an average annual return of 14.7% (i.e. an average gain of 14.7%) with a standard deviation of 33%. A return of 0% means the value of the portfolio doesn't change, a negative return means that the portfolio loses money, and a positive return means that the portfolio gains money. (please round answers to within one hundredth of a percent) (a) What percent of years does this portfolio lose money, i.e. have a return less than 0%? (b) What is the cutoff for the highest 15% of annual returns with this portfolio?arrow_forwardA stock has monthly returns of 4%, 5%, 2%, and -3%. Its geometric average return is closest to: O 195 O 2.43 O 3.36 O 4.17arrow_forwardThe annual percentage returns on common stocks over a 7-year period were as follows:4.0% 14.3% 19.0% -14.7% -26.5% 37.2% 23.8%Over the same period the annual percentage returns on U.S. Treasury Bills were as follows:6.5% 4.4% 3.8% 6.9% 8.0% 5.8% 5.1%a. Compare the means of these two population distributions.b. Compare the standard deviations of these two population distributions.arrow_forward
- Swain Athletic Gear (SAG) operates six retail outlets in a large Midwest city. One is in the center of the city on Cornwall Street and the others are scattered around the perimeter of the city. Management at SAG is concerned about declining sales and profitability of the Cornwall store and believes that outlet has been a drag on profits in recent years. The most recent income statement for the Cornwall store follows. SWAIN ATHLETIC GEAR Cornwall Street Store Income Statement For the Year Ending February 28 Sales revenue $ 12,300,000 Costs Cost of goods sold $ 5,289,000 Advertising 1,421,000 Store administrative salaries 975,000 Sales commissions 1,056,000 Leases and utilities 2,100,000 Allocated corporate support 1,622,000 Total costs $ 12,463,000 Net loss before tax benefit $ (163,000) Tax benefit at 25% (40,750) Net loss $ (122,250) The CFO at SAG has asked for your advice on closing the Cornwall Street store. If the Cornwall Street store is…arrow_forwardCorn crop yields vary by state. In 2008, IOWA averaged 172 bushels/acre. On September 3, 2009, the published market price per bushel was 319.25 cents/bushel. Jimmy Harold is analying a heavily leveraged purchase of some additional acreage, and his decision to purchase is based on the expected yield during his first crop year. After analyzing historical rainfall and long range weather forecasts, Jimmy compiled the following table of crop yields. rainfail yield(bu/acre) probability below average 154 0.15 average 172 0.4 above average 177 0.45 What is the expected corn crop yield, E[Y] based on the data in Jimmy's? E[Y] = (to 2 decimal places).arrow_forwardThe percentage of individual investors’ portfolios committed to stock depends on the state of the economy. As of April 2014, a typical portfolio consisted of cash (19%), stocks (30%), stock funds (37%), bonds (8%) and bond funds (6%). The following table reports the percentage of stocks in a typical portfolio in eight quarters of 2012 to 2013. Year Quarters Stock % 2012 1 29.8 2 31 3 29.9 4 30.1 2013 1 32.2 2 31.5 3 32 4 31.9 Calculate the centered 4 quarter moving average for the first quarter of 2013 (rounded to 4 decimals). A. 32.2103 B. 31.1875 C. 30.9251 D. 31.4523arrow_forward
arrow_back_ios
arrow_forward_ios
Recommended textbooks for you
 MATLAB: An Introduction with ApplicationsStatisticsISBN:9781119256830Author:Amos GilatPublisher:John Wiley & Sons Inc
 Probability and Statistics for Engineering and th...StatisticsISBN:9781305251809Author:Jay L. DevorePublisher:Cengage Learning
 Statistics for The Behavioral Sciences (MindTap C...StatisticsISBN:9781305504912Author:Frederick J Gravetter, Larry B. WallnauPublisher:Cengage Learning
 Elementary Statistics: Picturing the World (7th E...StatisticsISBN:9780134683416Author:Ron Larson, Betsy FarberPublisher:PEARSON
 The Basic Practice of StatisticsStatisticsISBN:9781319042578Author:David S. Moore, William I. Notz, Michael A. FlignerPublisher:W. H. Freeman
 Introduction to the Practice of StatisticsStatisticsISBN:9781319013387Author:David S. Moore, George P. McCabe, Bruce A. CraigPublisher:W. H. Freeman
MATLAB: An Introduction with Applications
Statistics
ISBN:9781119256830
Author:Amos Gilat
Publisher:John Wiley & Sons Inc
Probability and Statistics for Engineering and th...
Statistics
ISBN:9781305251809
Author:Jay L. Devore
Publisher:Cengage Learning
Statistics for The Behavioral Sciences (MindTap C...
Statistics
ISBN:9781305504912
Author:Frederick J Gravetter, Larry B. Wallnau
Publisher:Cengage Learning
Elementary Statistics: Picturing the World (7th E...
Statistics
ISBN:9780134683416
Author:Ron Larson, Betsy Farber
Publisher:PEARSON
The Basic Practice of Statistics
Statistics
ISBN:9781319042578
Author:David S. Moore, William I. Notz, Michael A. Fligner
Publisher:W. H. Freeman
Introduction to the Practice of Statistics
Statistics
ISBN:9781319013387
Author:David S. Moore, George P. McCabe, Bruce A. Craig
Publisher:W. H. Freeman
Continuous Probability Distributions - Basic Introduction; Author: The Organic Chemistry Tutor;https://www.youtube.com/watch?v=QxqxdQ_g2uw;License: Standard YouTube License, CC-BY
Probability Density Function (p.d.f.) Finding k (Part 1) | ExamSolutions; Author: ExamSolutions;https://www.youtube.com/watch?v=RsuS2ehsTDM;License: Standard YouTube License, CC-BY
Find the value of k so that the Function is a Probability Density Function; Author: The Math Sorcerer;https://www.youtube.com/watch?v=QqoCZWrVnbA;License: Standard Youtube License