Concept explainers
To fill:
The blanks in the given figure.
Introduction:
Extinction vortex is a model that helps the ecologists, biologists, and geneticists to determine the reason for the extinction of the species. This model reveals the causes that lead to the vulnerability of the small populations, as they spiral toward the extinction. This model was developed by M. E. Gilpin and M. E Soule in 1986.
Answer to Problem 1LTB
The figure below is labeled as:

Explanation of Solution
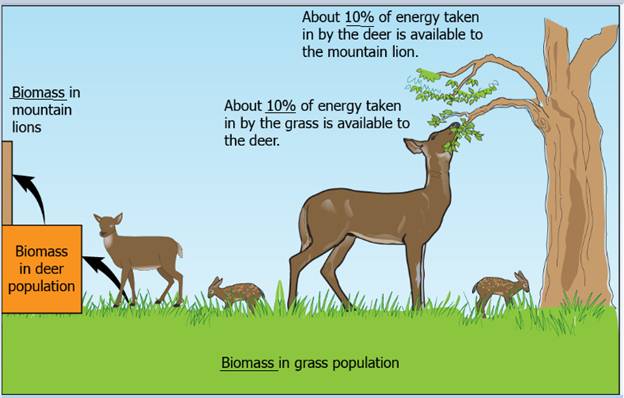
The given figures are the depiction of a graph which determines the amount of biomass of grass population transferred to mountain lions. The grass is an autotroph and makes its own food by the help of photosynthesis. When deer eat this grass, then only 10% of the energy in the grass is transferred to the deer. Further, when the lion eats the deer, then again, only 10% of the energy taken by the deer is transferred to the mountain lion.
The figure below is labeled as:
Want to see more full solutions like this?
Chapter 16 Solutions
Biology: Science for Life with Physiology (6th Edition) (Belk, Border & Maier, The Biology: Science for Life Series, 5th Edition)


- Which of the following methods will provide information to an ecologist about both the size and density of a population? a. mark and recapture b. mark and release c. quadrat d. life tablearrow_forwardComplete the following graph by labeling each bar (a-e) with a cause of extinction, from the most influential to the least influential. а. b. C. d. е. O 20 40 60 80 100 % Species Affected by Threatarrow_forwardMark Recapture can be written as M N = R Define each term. Use this equation to answer the following question. Show your work. A biologist for Mosaic fertilizer company catches 26 Florida scrub jays as part of their monthly environmental monitoring. Each bird is given a band. The next month, they catch 32 birds. 13 of the birds have bands. What is the estimated population size of the birds in that area?arrow_forward
- Use the Shannon-Weiner Diversity equation to calculate diversity (H). Which treatment (predator enclosure, no predator enclosure) is more diverse? Why do you think this is the case? Predator Enclosure: Species Number A 5 B 1 C 4 D 2 E 12 No Predator Enclosure: Species Number A 7 B 9 C 17 D 3arrow_forwardUse the graphs to answer the question below. In each of the figures, the x-axis represents time, and the y-axis represents population size. The solid line is population size of Species 1; the dashed line is population size of Species 2. ir is Le asA А. В. С. D. The population represented by the solid line on Graph A above is growing... O Exponentially O Logisticallyarrow_forwardThe diagram below shows patches of habitat that are either colonized (red dots) or not colonized (green dots). Which conclusion can be drawn from the data? 100 10 1 0.1 0.01 Patch status in 1991 • Colonized Not colonized 0.01 0.1 1 10 100 Distance from nearest occupied patch (km) A. Patches that have the smallest area and are closest to another occupied patch are most likely to be colonized. B. Patches with the smallest area are most likely to be colonized; the distance to the nearest occupied patch does not affect colonization rates. C. Patches that are very close to another occupied patch or that have large areas are most likely to be colonized. D. Patches that have the largest area and are farthest away from another occupied patch are most likely to be colonized. E. There is no relationship between patch size and rate of colonization. Patch area (ha)arrow_forward
- A population of 300 fairy wrens colonizes a cloud forest without any other wrens in it. The cloud forest has a carrying capacity of 500 wrens. Fairy wrens have a maximum potential growth rate of 80%. How large will the fairy wren population be in two years (rounded to the nearest whole wren)? ***note that the current time frame is year 0. You will have to calculate years 1, and 2. 462 429 405 492arrow_forwardThe diagram below shows patches of habitat that are either colonized (red dots) or not colonized (green dots). Which conclusion can be drawn from the data? 100 10 0.1 0.01 Patch status in 1991 • Colonized • Not colonized 0.01 0.1 10 100 Distance from nearest occupied patch (km) A. Patches that have the smallest area and are closest to another occupied patch are most likely to be colonized. B. Patches with the smallest area are most likely to be colonized; the distance to the nearest occupied patch does not affect colonization rates. C. Patches that are very close to another occupied patch or that have large areas are most likely to be colonized. D. Patches that have the largest area and are farthest away from another occupied patch are most likely to be colonized. E. There is no relationship between patch size and rate of colonization. 1. (a) Patch areaarrow_forwardExamine the statements below and score them as true or false. 1. According to the MacArthur-Wilson theory of island biogeography, the immigration curve starts out steep but gets progressively shallower. 2. The extinction curve also starts out steeply but quickly declines. 3. Extinction rates are lower on larger islands. 4. The numbers of species should increase with increasing distance from the mainland. (Click to select) v (Click to select) (Click to select) (Click to select) v 5. There should be considerable turnover of species on islands. (Click to select)arrow_forward
- Relationship of Predation in the extinction of some animals. DISCUSS.arrow_forwardChange in Rabbit Population 1850-2000 100 90 80 70 60 50 40 30 20 10 white gray white gray 1850 2000 In 1850 there was a large snowshoe rabbit population in Manitoba, Canada. Over the years, the winter coloration (the color of the rabbit's fur) of the surviving rabbit population changed. The graph shows the change in winter coloration of rabbits between 185 to 2000. Based on the data, we could hypothesize that A) the winters are longer in length. B) the snowshoe rabbit has migrated to another area. the amount of snow cover varied over the years. D) more snowshoe rabbit predators have moved into Manitoba. % Populationarrow_forwardwhat is background extinction ratearrow_forward
 Concepts of BiologyBiologyISBN:9781938168116Author:Samantha Fowler, Rebecca Roush, James WisePublisher:OpenStax College