
Concept explainers
Interpretation: The control over production process is to be assessed using the
Concept Introduction:
Answer to Problem 2CSQD
The mean and range values are well within the control limits as seen from the x bar and R charts. Hence, the production process is in control.
Explanation of Solution
Given information:
 The
The
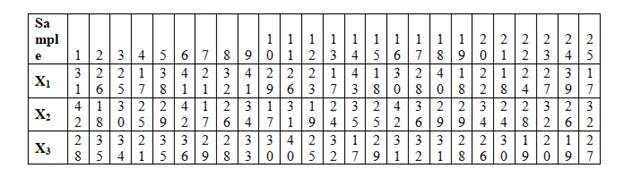
The sample mean and range are calculated and shown below:
| Sample | X1 | X2 | X3 | Sample mean(X1+X2+X3)/3 | Sample Range |
| 1 | 31 | 42 | 28 | 33.67 {(31+42+28)/3=33.67} | 14 |
| 2 | 26 | 18 | 35 | 26.33 | 17 |
| 3 | 25 | 30 | 34 | 29.67 | 9 |
| 4 | 17 | 25 | 21 | 21.00 | 8 |
| 5 | 38 | 29 | 35 | 34.00 | 9 |
| 6 | 41 | 42 | 36 | 39.67 | 6 |
| 7 | 21 | 17 | 29 | 22.33 | 12 |
| 8 | 32 | 26 | 28 | 28.67 | 6 |
| 9 | 41 | 34 | 33 | 36.00 | 8 |
| 10 | 29 | 17 | 30 | 25.33 | 13 |
| 11 | 26 | 31 | 40 | 32.33 | 14 |
| 12 | 23 | 19 | 25 | 22.33 | 6 |
| 13 | 17 | 24 | 32 | 24.33 | 15 |
| 14 | 43 | 35 | 17 | 31.67 | 26 |
| 15 | 18 | 25 | 29 | 24.00 | 11 |
| 16 | 30 | 42 | 31 | 34.33 | 12 |
| 17 | 28 | 36 | 32 | 32.00 | 8 |
| 18 | 40 | 29 | 31 | 33.33 | 11 |
| 19 | 18 | 29 | 28 | 25.00 | 11 |
| 20 | 22 | 34 | 26 | 27.33 | 12 |
| 21 | 18 | 24 | 30 | 24.00 | 12 |
| 22 | 24 | 28 | 19 | 23.67 | 9 |
| 23 | 27 | 32 | 20 | 26.33 | 12 |
| 24 | 39 | 26 | 19 | 28.00 | 20 |
| 25 | 17 | 32 | 27 | 25.33 | 15 |
| Total | 710.67 | 296 | |||
| Average | 28.43 | 11.84 |
From the 3-sigma standard control chart, the coefficient values are obtained as follows:
And the control limits are calculated
The
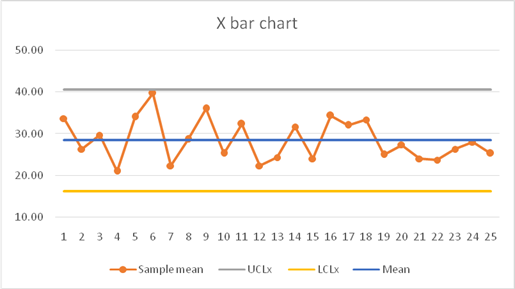
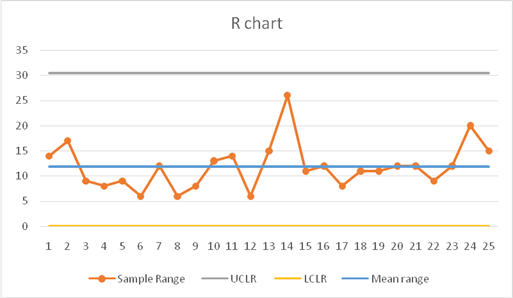
The mean and range values are well within the control limits and hence the process is in control.
Want to see more full solutions like this?


- Explain the concept and use of statistical quality control? Name control charts that can be usedarrow_forwardDescribe how to construct process control charts and use them to determine whether a process is out of statistical control.arrow_forwardExplain how to construct process control chart and use them to determine whether a process is out of statistical control?arrow_forward
- Explain how to contruct process control chart and use them to determine whether a process is out of statistical control.arrow_forwardWhat is it important to prove that a process is proven capable before developing statistical control limit ?arrow_forwardCan you please explain the steps to create the control chart ?arrow_forward
- Distinguish variable and attribute data. What types of control charts are used for each? Explain with examples related to healthcare.arrow_forwardWhen most processes are sampled for control chart purposes, why aren't they in statistical control?arrow_forwardBriefly explain the purpose of each of these control charts:b. Rangearrow_forward
- Describe why is order of observation important in process control ?arrow_forwardWhat makes statistical process management such an important tool for quality control?arrow_forwardInter-State Moving and Storage Company wishes to establish a control chart to monitor the proportion of residential moves that result in written complaints due to late delivery, lost items, or damaged items. A sample of 40 moves is selected for each of the last 12 months. The number of written complaints in each sample is 9, 7, 4, 9, 1, 9, 11, 5, 5, 8, 7, and 15. Number Defective Percent defective 9 18 7 14 4 8 9 18 1 2 9 18 11 22 5 10 5 10 8 16 7 14 15 30 a. Insert the mean proportion defective, UCL, and LCL. (Leave no cells blank - be certain to enter "0" wherever required. Round your intermediate calculations and final answers to 2 decimal places.) Mean proportion defective UCL LCL c. Does it appear that the number of complaints is out of control for any of the months?multiple choice Yes Noarrow_forward
 Practical Management ScienceOperations ManagementISBN:9781337406659Author:WINSTON, Wayne L.Publisher:Cengage,
 Operations ManagementOperations ManagementISBN:9781259667473Author:William J StevensonPublisher:McGraw-Hill Education
 Operations and Supply Chain Management (Mcgraw-hi...Operations ManagementISBN:9781259666100Author:F. Robert Jacobs, Richard B ChasePublisher:McGraw-Hill Education
 Purchasing and Supply Chain ManagementOperations ManagementISBN:9781285869681Author:Robert M. Monczka, Robert B. Handfield, Larry C. Giunipero, James L. PattersonPublisher:Cengage Learning
 Production and Operations Analysis, Seventh Editi...Operations ManagementISBN:9781478623069Author:Steven Nahmias, Tava Lennon OlsenPublisher:Waveland Press, Inc.