
Macroeconomics (7th Edition)
7th Edition
ISBN: 9780134738314
Author: R. Glenn Hubbard, Anthony Patrick O'Brien
Publisher: PEARSON
expand_more
expand_more
format_list_bulleted
Videos
Textbook Question
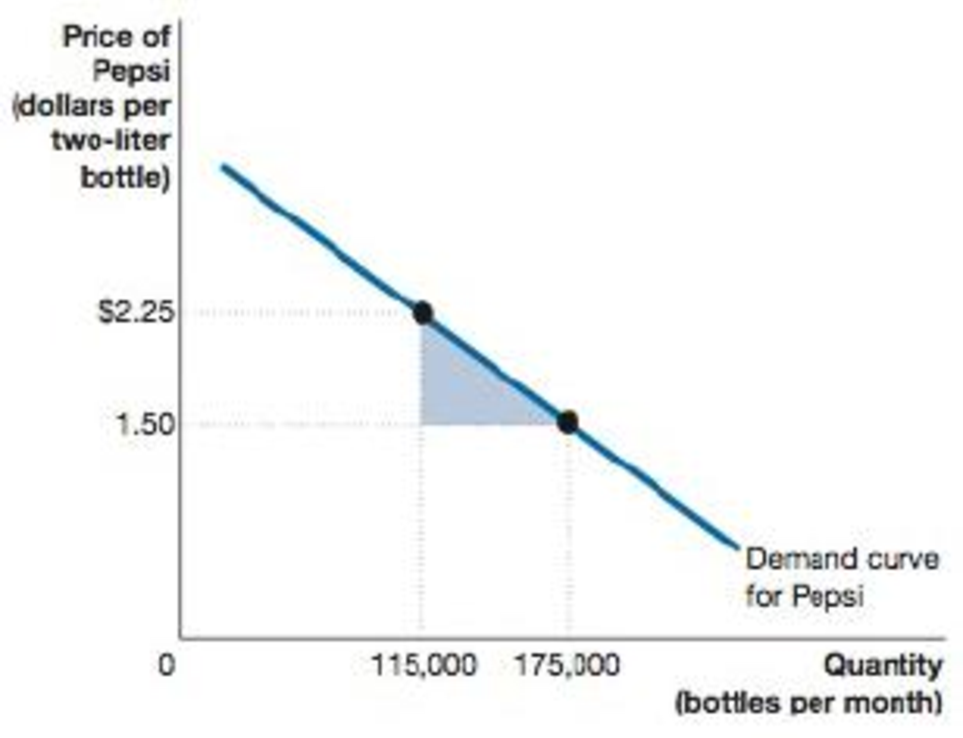
Chapter 1.A, Problem 6PA
What is the area of the triangle shown in the following figure?
Expert Solution & Answer

Trending nowThis is a popular solution!

Students have asked these similar questions
The following diagram shows two triangles.
DISTANCE (Inches)
10
9
8
7
2
1
0
←
0
1
2
3
5
4
6
DISTANCE (Inches)
The green (upper) triangle has an area of
7
8
9
Đ
10
?
The purple (lower) triangle has an area of
Place the orange triangle (square symbols) directly next to the green triangle so that the two triangles together make a rectangle. The total area of
this rectangle is
the area of the green triangle.
which is
Can you draw all of this shifts with graph
The following graph shows the annual market for Florida oranges, which are sold in units of 90-pound boxes.
Use the graph input tool to help you answer the following questions. You will not be graded on any changes you make to this graph.
Note: Once you enter a value in a white field, the graph and any corresponding amounts in each grey field will change accordingly.
07014021028035042049056063070050454035302520151050PRICE (Dollars per box)QUANTITY (Millions of boxes)Demand Supply
Graph Input Tool
Market for Florida Oranges
Price
(Dollars per box)
Quantity Demanded
(Millions of boxes)
Quantity Supplied
(Millions of boxes)
In this market, the equilibrium price is
per box, and the equilibrium quantity of oranges is
million boxes.
For each of the prices listed in the following table, determine the quantity of oranges demanded, the quantity of oranges supplied, and the direction of pressure exerted on prices…
Chapter 1 Solutions
Macroeconomics (7th Edition)
Ch. 1.A - Prob. 1PACh. 1.A - Prob. 2PACh. 1.A - Prob. 3PACh. 1.A - Prob. 4PACh. 1.A - Prob. 5PACh. 1.A - What is the area of the triangle shown in the...Ch. 1.A - Prob. 7PACh. 1 - Prob. 1TCCh. 1 - Prob. 2TCCh. 1 - Prob. 1.1.1RQ
Ch. 1 - Prob. 1.1.2RQCh. 1 - Prob. 1.1.3PACh. 1 - Prob. 1.1.4PACh. 1 - Prob. 1.1.5PACh. 1 - Prob. 1.1.6PACh. 1 - Prob. 1.1.7PACh. 1 - Prob. 1.1.8PACh. 1 - Prob. 1.1.9PACh. 1 - Prob. 1.1.10PACh. 1 - Prob. 1.1.11PACh. 1 - Prob. 1.2.1RQCh. 1 - Prob. 1.2.2RQCh. 1 - Prob. 1.2.3RQCh. 1 - Prob. 1.2.4RQCh. 1 - Prob. 1.2.5PACh. 1 - Prob. 1.2.6PACh. 1 - Prob. 1.2.7PACh. 1 - Prob. 1.2.8PACh. 1 - Prob. 1.2.9PACh. 1 - Prob. 1.2.10PACh. 1 - Prob. 1.2.11PACh. 1 - Prob. 1.2.12PACh. 1 - Prob. 1.2.13PACh. 1 - Prob. 1.3.1RQCh. 1 - Prob. 1.3.2RQCh. 1 - Prob. 1.3.3RQCh. 1 - Prob. 1.3.4PACh. 1 - Prob. 1.3.5PACh. 1 - Prob. 1.3.6PACh. 1 - Prob. 1.3.7PACh. 1 - Prob. 1.3.8PACh. 1 - Prob. 1.3.9PACh. 1 - Prob. 1.3.10PACh. 1 - Prob. 1.3.11PACh. 1 - Prob. 1.4.1RQCh. 1 - Prob. 1.4.2RQCh. 1 - Prob. 1.4.3PACh. 1 - Prob. 1.4.4PACh. 1 - Prob. 1.1CTECh. 1 - Prob. 1.2CTE
Additional Business Textbook Solutions
Find more solutions based on key concepts
• Illustrate and interpret shifts in the short-run and long-run aggregate supply curves.
Economics of Money, Banking and Financial Markets, The, Business School Edition (4th Edition) (The Pearson Series in Economics)
You are advising a coffee shop manager who wants to estimate how much sales will change if the price of a latte...
Microeconomics
Explain how to derive a total expenditures (TE) curve.
Macroeconomics (Book Only)
Determine the price elasticity of demand if, in response to an increase in price of 10 percent, quantity demand...
Microeconomics
Drought cuts the quantity of wheat grown by 2 percent. If the price elasticity of demand for wheat is 0.5, by h...
Foundations of Economics (8th Edition)
Knowledge Booster


Learn more about
Need a deep-dive on the concept behind this application? Look no further. Learn more about this topic, economics and related others by exploring similar questions and additional content below.Similar questions
- Can someone help me make a graph on this?arrow_forwardDefine the following terms and give an example: (see attached image)arrow_forwardThe following graph shows the annual market for Michigan blueberries, which are sold in units of 50-pound boxes. Use the graph input tool to help you answer the following questions. You will not be graded on any changes you make to this graph. Note: Once you enter a value in a white field, the graph and any corresponding amounts in each grey field will change accordingly. 08016024032040048056064072080050454035302520151050PRICE (Dollars per box)QUANTITY (Millions of boxes)Demand Supply Graph Input Tool Market for Michigan Blueberries Price (Dollars per box) Quantity Demanded (Millions of boxes) Quantity Supplied (Millions of boxes) In this market, the equilibrium price is per box, and the equilibrium quantity of blueberries is million boxes. For each of the prices listed in the following table, determine the quantity of blueberries demanded, the quantity of blueberries supplied, and the direction of pressure…arrow_forward
- A tax on gasoline is proposed in order to raise money for the pollution-control activities of several public agencies. The tax will be 10¢ per gallon, and last year 10.3 million gallons of gasoline were used by motorists (this is strictly an illustrative number). Does this mean that we can anticipate $1,030,000 in revenues from this tax? Explain and use a graph to answer this question.arrow_forwardOlivia and Yixing are volunteering at a cat rescue shelter. The shelter supervisor asks them to clean out kennels and haul bags of cat food from the donation area into storage. It takes Olivia 6 minutes to clean out a kennel and 6 minutes to move a bag of food. It takes Yixing 10 minutes to clean out a kennel and 12 minutes to move a bag of food. For the following questions, round each answer to the nearest tenth. a. ( Yixing, Olivia _______has an absolute advantage in completing both tasks. b. Olivia’s opportunity cost of cleaning a kennel: _____ bags of food moved. c. Olivia’s opportunity cost of moving one bag of food: ______kennels cleaned. d. Yixing’s opportunity cost of cleaning a kennel: ______bags of food moved. e. Yixing’s opportunity cost of moving one bag of food: ______kennels cleaned. f. Yixing says it does not matter which task each of them performs, because Olivia is faster at both tasks.…arrow_forwardFelicity is studying economics and political science. She can read 30 pages of political science per hour but only 5 pages of economics per hour. This week she has a 50-page assignment in economics and a 150- page assignment in political science. Because of sorority rush, she cannot devote more than 10 hours to studying these subjects this week. She realizes she cannot complete all of her assignments but is determined to complete at least 30 pages of her economics reading. Draw a graph with pages of economics on the horizontal axis and pages of political science on the vertical axis. On this graph, show the possibilities that are consistent with the constraints that Felicity has imposed on herself, i.e. show her choice set. (She is NOT allowed to read ahead in either subject.) Label key points on your graph with their numerical values.arrow_forward
- Felicity is studying economics and political science. She can read 30 pages of political science per hour but only 5 pages of economics per hour. This week she has a 50 -page assignment in economics and a 150 -page assignment in political science. Because of sorority rush, she cannot devote more than 10 hours to studying these subjects this week. She realizes she cannot complete all of her assignments but is determined to complete at least 30 pages of her economics reading. Draw a graph with pages of economics on the horizontal axis and pages of political science on the vertical axis. On this graph, show the possibilities that are consistent with the constraints that Felicity has imposed on berself, i.e, show her choice set. (She is NOT allowed to read abead in either subject.) Label key points on your graph with their numerical values. Belinda loves chocolate and always thinks that more is better than less. Belinda thinks that a few piano lessons would be worse than none at all, but…arrow_forwardGovernment-imposed taxes cause reductions in the activity that is being taxed, which has important implications for revenue collections. To understand the effect of such a tax, consider the monthly market for rum, which is shown on the following graph. Use the graph input tool to help you answer the following questions. You will not be graded on any changes you make to this graph. Note: Once you enter a value in a white field, the graph and any corresponding amounts in each grey field will change accordingly.arrow_forwardCH SESSION 1.2: SELF-ASSESSMENT EXERCISE 1. Briefly explain the use of graphs as a way to represent economic relationships. What is an inverse relationship? How does it graph? What is direct relationship? How does it graph? 2. Graph each of the following sets of numbers in table 2 below. Draw a line through the points and calculate the slope of each line. 2X4 1 2 3 1 Y 5 10 20 X 0 5 20 2 Y 0 5 10 20 X 1 2 3 3 Y 25 20 15 X 0.1 0.3 Y 100 75 50 25 Table 2 3. For each of the graphs in table 2 above, determine whether the curve has a positive or a negative slope. Give an intuitive explanation for what is happening with the slope of each curve. ICON 1000 Principles of Economics I- UNIT 1 11arrow_forward
arrow_back_ios
SEE MORE QUESTIONS
arrow_forward_ios
Recommended textbooks for you
 Economics (MindTap Course List)EconomicsISBN:9781337617383Author:Roger A. ArnoldPublisher:Cengage Learning

Economics (MindTap Course List)
Economics
ISBN:9781337617383
Author:Roger A. Arnold
Publisher:Cengage Learning
Forecasting: Exponential Smoothing, MSE; Author: Joshua Emmanuel;https://www.youtube.com/watch?v=k_HN0wOKDd0;License: Standard Youtube License