
Concept explainers
a
To prove:
Graphical representation of utility function whether IC curve is convex or not.
a
Explanation of Solution
The utility function is linear. This means that the goods x and y are perfect substitutes. For simplicity, the value of utility is taken to be constant at 60. Then the equation for the indifference curve becomes:
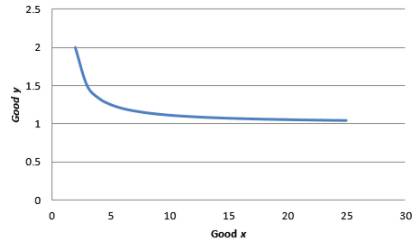
To graph the indifference curve:
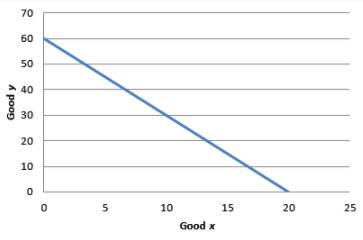
Graph 1
The MRS is constant at 3. Hence, the IC curve is not convex.
Introduction:
Rate of substitution is the ratio of two goods at which consumer gives away a quantity of good 1 in order to get good 2
b)
To prove:
Graphical representation of utility function whether IC curve is convex or not.
b)
Explanation of Solution
Let utility function be set equal to 10.
Then the equation will be:
The IC for utility equal to 10 can be obtained by graphing the following equation:
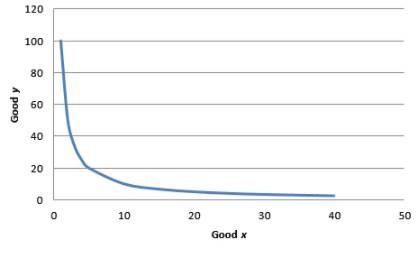
Graph 2
For equation,
As x is in the denominator, the MRS decreases when x increases. Hence indifference curve is convex.
Introduction:
Rate of substitution is the ratio of two goods at which consumer gives away a quantity of good 1 in order to get good 2
c)
To prove:
Graphical representation of utility function whether IC curve is convex or not.
c)
Explanation of Solution
To simplify the function, arbitrarily set the utility at 8. So, the utility function becomes
Graphical representation:
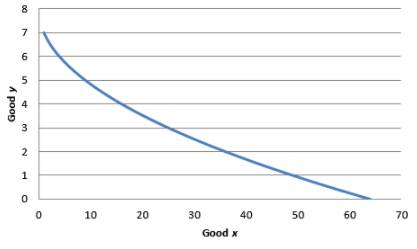
Graph 3
As x is in the denominator, the MRS decreases when x increases. Hence indifference curve is convex.
Introduction:
Rate of substitution is the ratio of two goods at which consumer gives away a quantity of good 1 in order to get good 2
d)
To prove:
Graphical representation of utility function whether IC curve is convex or not.
d)
Explanation of Solution
Utility is set equal to 4. Then the equation for equation is:
The indifference curve for utility equal to 4:
The graph is shown below:
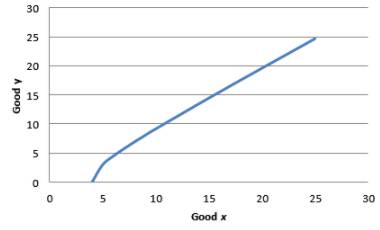
Graph 4
In the above equation, x is numerator. Though there is a negative sign in front of the fraction. This means that as x increases, the marginal rate of substitution increases.
Hence, the indifference curves are not convex.
Introduction:
Rate of substitution is the ratio of two goods at which consumer gives away a quantity of good 1 in order to get good 2
e)
To prove:
Graphical representation of utility function whether IC curve is convex or not.
e)
Explanation of Solution
To simplify the problem, we arbitrarily take utility equal to 1.
To graph the indifference curve,
Graph 5
MRS =
In the above equation, x is in numerator. Hence, as x increases the marginal rate of substitution decreases. Hence, the indifference curves are convex.
Introduction:
Rate of substitution is the ratio of two goods at which consumer gives away a quantity of good 1 in order to get good 2
Want to see more full solutions like this?


- Draw indifference curves for the following utility functions. a) u(x, y) = x+ 2y b) u(x, y) = min{x, 3y}arrow_forwardConsider the following utility function: u(x1,x2) = x1 + x2. (A): i) Restate the consumer problem. ii) Form the Lagrangian function. iii) Find the first-order-conditions (FOC). iv) Divide Lx, by Lx,- v) From iv), can you determine the type of goods 1 and 2 are? (В): Draw the indifference curves for U = X1 + x2, where U = 1 and 2. What happens to the optimal demand for good 1, when: P1 P2 1. 3. Pi = P2arrow_forwardSuppose that one of your friends does not care if she consumes spaghetti (S) or noodle (N). She wants toconsume either two-dish spaghetti or two-dish noodle or any combination of both which adds up to twodishes.(i) Write the utility function of your friend to represent his preferences.(ii) Draw couple of indifference curves of your friend on graph with appropriate labels.(iii) Denote prices as Pn, Ps; income as M. If Pn < Ps, then determine the demand function of your friend foreach product as a function of prices and income.arrow_forward
- For each of the following utility functions draw the indifference curve that passes through (1,1). Label at least three points on each curve and indicate the direction of increased preference: a) u(x1, x2 ) = 3x1 b) u(x1, x2 ) = x1 + 2x2 c) u(x1, x2 ) = x1+ logx2 d) u(x1, x2 ) = min (2x1, x2) e) u(x1, х2) %3D max (1, x2)arrow_forward3.1 Graph a typical indifference curve for the following utility functions, and determine whether they have convex indifference curves (i.e., whether the MRS declines as x increases). c. U(x, y) = √x + y. d. U(x, y) = √x² - y². xy x+y e. U(x, y) =arrow_forwardDonald likes fishing (X1) and hanging out in his hammock (X2). His utility function for these two activities is u(x1, x2) = 3X12X24. (A) Calculate MU1, the marginal utility of fishing. (B) Calculate MU2, the marginal utility of hanging out in his hammock. (C) Calculate MRS, the rate at which he is willing to substitute hanging out in his hammock for fishing. (D)Last week, Donald fished 2 hours a day, and hung out in his hammock 4 hours a day. Using your formula for MRS from (c) find his MRS last week. (E) This week, Donald is fishing eight hours a day, and hanging out in his ham mock two hours a day. Calculate his MRS this week. Has his MRS increased or decreased? Explain why? (F) Is Donald happier or sadder this week compared to last week? Explain.arrow_forward
- Suppose an individual has a utility function u (x1, x2) = 2*2. Present your mathmatical expressions below in the simplest form you can. a) Derive an expression for the marginal utility of good 1, and for the marginal utility of good 2. b) Using these, solve for an expression describing the slope of an indifference curve: MRS (11, 12). c) Sketch indifference curves for this consumer corresponding to u = 0,10,20. (Hint: z rı = k solves for m} = 11 (21) . Solve this expression and approximate it on a graph for the three values of k.)arrow_forwardAn agent has utility u(x1, x2) = (x-11+x-12)-1for goods x1 and x2. The prices of the goods are p1 and p2. The agent has income m. a) Show preferences are convex. You can do this graphically or by showing that MRS is decreasing in x1. b) Solve for the agent’s optimal choice of (x1, x2). c) Show the agent’s indirect utility function is given by:V=m(p1/21 + p1/22)2arrow_forwardGiven that utility function for a consumer is given by u = (x-3)2 + (y-4)2, draw any twoindifference curves for this consumer while clearly labelling the higher one as ‘H’ and lower oneas ‘L’. Does he prefer more of a good to less of it? Does he prefer averages to extremebundles? Explain.arrow_forward
- b) Define indifference curve and discuss the characteristics of an indifferencecurve.arrow_forwardA consumer with income I=120 facing prices pX = 4 and pY = 8 for two goods X and Y (for each good she prefers more to less) chooses optimally to consume 12 units of X. If the prices change and now pX = 6 and pY = 4, what is the possible range for her optimal X consumption? (like, x >/ 7 or 10 >/ x >/7…etc. Use indifference curve analysis on a graph to reason about the possible locations of the new optimal bundle.)arrow_forwardSketch indifference curve for the given utility levels. Use arrow to show the direction in which utility is increasing U(x,y) = 2y ; U=10 U(x.y) = (X+2Y)2 U = 9 U(x,y) = min(2X, X+Y) U = 6 U(x,y) = XY 2, U = 16 (hint: MUx=Y2 MUy =-2XY3 and slope of indifference curve = MRS = -MUx/MÜy) %3Darrow_forward

 Economics (MindTap Course List)EconomicsISBN:9781337617383Author:Roger A. ArnoldPublisher:Cengage Learning