
Concept explainers
Videos
(a)
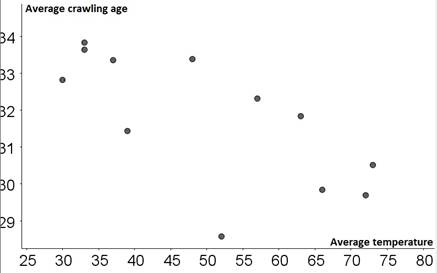
To construct the scatterplot that displays the relationship between average crawling age and average temperature.
(a)
Explanation of Solution
The scatterplot that displays the relationship between average crawling age and average temperature is as follows:
(b)
To describe the direction, strength and form of the relationship and conclude about when babies learn to crawl.
(b)
Explanation of Solution
Since the scatterplot slopes downwards, the graph has a negative association which seems to be weak (points lie far from each other). The scatterplot also shows a linear relationship, because there is no strong curvature in the scatterplot.
Chapter 4 Solutions
Statistics Through Applications
Additional Math Textbook Solutions
Elementary Statistics: Picturing the World (7th Edition)
Essentials of Statistics, Books a la Carte Edition (5th Edition)
Statistical Reasoning for Everyday Life (5th Edition)
Elementary Statistics (13th Edition)
Introductory Statistics (2nd Edition)


 MATLAB: An Introduction with ApplicationsStatisticsISBN:9781119256830Author:Amos GilatPublisher:John Wiley & Sons Inc
 Probability and Statistics for Engineering and th...StatisticsISBN:9781305251809Author:Jay L. DevorePublisher:Cengage Learning
 Statistics for The Behavioral Sciences (MindTap C...StatisticsISBN:9781305504912Author:Frederick J Gravetter, Larry B. WallnauPublisher:Cengage Learning
 Elementary Statistics: Picturing the World (7th E...StatisticsISBN:9780134683416Author:Ron Larson, Betsy FarberPublisher:PEARSON
 The Basic Practice of StatisticsStatisticsISBN:9781319042578Author:David S. Moore, William I. Notz, Michael A. FlignerPublisher:W. H. Freeman
 Introduction to the Practice of StatisticsStatisticsISBN:9781319013387Author:David S. Moore, George P. McCabe, Bruce A. CraigPublisher:W. H. Freeman