
Concept explainers
Videos
Contribution margin, break-even sales, cost-volume-profit chart, margin of safety, and operating leverage
Belmain Co. expects to maintain the same inventories at the end of 20Y7 as at the beginning of the year. The total of all production costs for the year is therefore assumed to be equal to the cost of goods sold. With this in mind, the various department heads were asked to submit estimates of the costs for their departments during the year. A summary report of these estimates is as follows:

It is expected that 12,000 units will be sold at a price of $240 a unit. Maximum sales within the relevant range are 18,000 units.
Instructions
- 1. Prepare an estimated income statement for 20Y7.
- 2. What is the expected contribution margin ratio?
- 3. Determine the break-even sales in units and dollars.
- 4. Construct a cost-volume-profit chart indicating the break-even sales.
- 5. What is the expected margin of safety in dollars and as a percentage of sales? (Round to one decimal place.)
- 6. Determine the operating leverage.
1.
Prepare an estimated income statement for 20Y7.
Explanation of Solution
Cost-Volume-Profit Analysis: It is a method followed to analyze the relationship between the sales, costs, and the related profit or loss at various levels of units sold. In other words, it shows the effect of the changes in the cost and the sales volume on the operating income of the company.
Prepare an estimated income statement for 20Y7.
| Company B | |||
| Estimated Income Statement | |||
| For the year ended December 31, 20Y8 | |||
| Particulars | Amount ($) | Amount ($) | Amount ($) |
| Sales (1) | 2,880,000 | ||
| Less: Cost of Goods sold: | |||
| Direct Materials (2) | 600,000 | ||
| Direct Labor (3) | 360,000 | ||
| Factory Overhead (4) | 422,000 | ||
| Cost of Goods Sold | (1,382,000) | ||
| Gross Profit | 1,498,000 | ||
| Less: Expenses: | |||
| Selling expenses: | |||
| Sales salaries and commissions (5) | 388,000 | ||
| Advertising | 116,000 | ||
| Travel | 4,000 | ||
| Miscellaneous selling expense (6) | 14,300 | ||
| Total selling expenses | 522,300 | ||
| Administrative expenses: | |||
| Office and Officers’ salaries | 325,000 | ||
| Supplies (7) | 54,000 | ||
| Miscellaneous administrative expenses (8) | 20,700 | ||
| Total administrative expenses | 399,700 | ||
| Total expenses | (922,000) | ||
| Income from operations | 576,000 | ||
Table (1)
Working note (1):
Determine sales.
Number of units to be sold =12,000 units
Selling price per unit =$240 per unit
Working note (2):
Determine the cost of direct materials.
Number of units to be sold =12,000 units
Direct Materials cost per unit =$50 per unit
Working note (3):
Determine the cost of direct labor.
Number of units to be sold =12,000 units
Direct labor cost per unit =$30 per unit
Working note (4):
Determine the cost of factory overhead.
Factory overhead-Fixed =$350,000
Number of units to be sold =12,000 units
Factory overhead-Variable cost per unit =$6 per unit
Working note (5):
Determine the sales salaries and commissions.
Sales salaries and commissions-Fixed =$340,000
Number of units to be sold =12,000 units
Sales salaries and commissions-Variable cost per unit =$4 per unit
Working note (6):
Determine the miscellaneous selling expense.
Miscellaneous selling expense-Fixed =$2,300
Number of units to be sold =12,000 units
Miscellaneous selling expense-Variable cost per unit =$1 per unit
Working note (7):
Determine the supplies.
Supplies-Fixed =$6,000
Number of units to be sold =12,000 units
Supplies-Variable cost per unit =$4 per unit
Working note (8):
Determine the miscellaneous administrative expense.
Miscellaneous administrative expense-Fixed =$8,700
Number of units to be sold =12,000 units
Miscellaneous administrative expense-Variable cost per unit =$1 per unit
2.
Calculate the expected contribution margin ratio.
Explanation of Solution
Determine the expected contribution margin ratio.
Sales =$2,880,000 (1)
Variable cost =$1,152,000 (9)
Working note (9):
Determine the variable cost.
Number of units to be sold =12,000 units
Variable cost per unit =$96 per unit
Therefore, the expected contribution margin ratio is 60%.
3.
Calculate the break-even sales in units and dollars.
Explanation of Solution
Determine the break-even sales in units.
Fixed cost =$1,152,000
Contribution margin per unit =$144 per unit (10)
Working note (10):
Compute the contribution margin per unit.
Selling price per unit =$240 per unit
Variable cost per unit =$96 per unit
Determine the break-even sales in dollars.
Fixed cost =$1,152,000
Contribution margin ratio =60% (refer Part 2)
Therefore, the break-even sales in units is 8,000 units and dollars is $1,920,000.
4.
Construct a cost-volume-profit chart indicating the break-even sales.
Explanation of Solution
Construct a cost-volume-profit chart indicating the break-even sales.
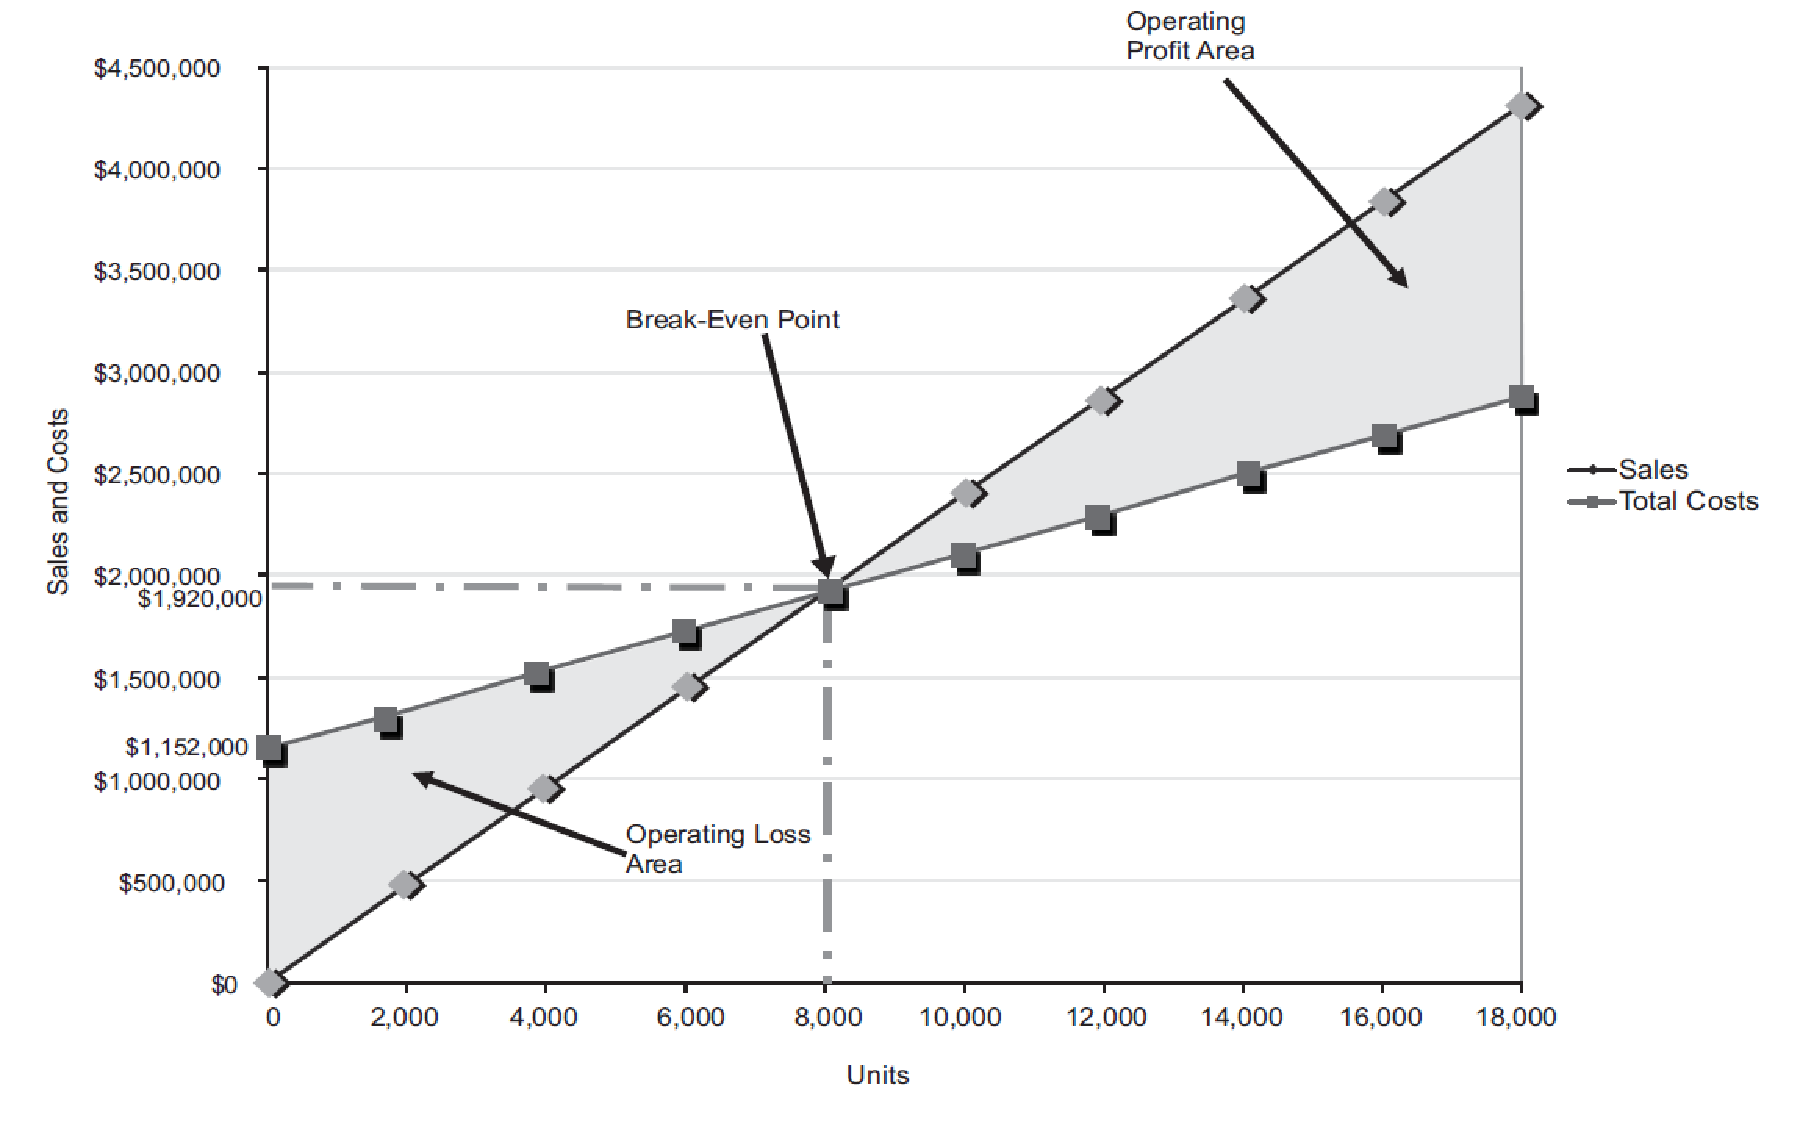
Figure (1)
The volume in units of sales is shown on the horizontal axis. The maximum relevant range is 18,000 units. The sales and the total costs (fixed cost and variable cost) in dollars is shown on the vertical axis. The maximum relevant range of sales and total costs is $4,500,000.
The total sales line is drawn right upward by connecting the first point at $0 to the second point at $4,320,000
The total cost line is drawn right upward by connecting the first point at $1,152,000 (fixed cost) on the vertical axis to the second point at
The break-even point is the intersection point where the total sales line and total cost line meet. The vertical dotted line drawn downward from the intersection point reaches at 8,000 units. It indicates the break-even sales (units). The horizontal line drawn to the left towards the vertical axis reaches at $1,920,000. It indicates the break-even sales (dollars). Refer Part 3 for the break-even values.
The operating profit area is the area where the total sales line exceeds the total cost line. However, the operating loss area is the area where the total cost exceeds the total sales line.
5.
Calculate the expected margin of safety in dollars and as a percentage of sales.
Explanation of Solution
Determine the expected margin of safety in dollars.
Sales =$2,880,000 (1)
Sales at break-even point =$1,920,000 (refer Part 3)
Determine the expected margin of safety as a percentage of sales.
Sales =$2,880,000 (1)
Margin of Safety in dollars =$960,000
Therefore, the expected margin of safety in dollars is $960,000 and as a percentage of sales is 33.3%.
6.
Calculate the operating leverage.
Explanation of Solution
Determine the operating leverage.
Contribution margin =$1,728,000 (11)
Income from operations =$576,000 (refer Table 1)
Working note (11):
Determine the contribution margin
Sales =$2,880,000 (1)
Variable cost =$1,152,000 (9)
Therefore, the operating leverage is 3.
Want to see more full solutions like this?
Chapter 6 Solutions
Managerial Accounting


- Sales Revenue Approach, Variable Cost Ratio, Contribution Margin Ratio Arberg Companys controller prepared the following budgeted income statement for the coming year: Required: 1. What is Arbergs variable cost ratio? What is its contribution margin ratio? 2. Suppose Arbergs actual revenues are 30,000 more than budgeted. By how much will operating income increase? Give the answer without preparing a new income statement 3. How much sales revenue must Arberg earn to break even? Prepare a contribution margin income statement to verify the accuracy of your answer. 4. What is Arbergs expected margin of safety? 5. What is Arbergs margin of safety if sales revenue is 380,000?arrow_forwardIncome Statements under Absorption and Variable Costing In the coming year, Kalling Company expects to sell 28,700 units at 32 each. Kallings controller provided the following information for the coming year: Required: 1. Calculate the cost of one unit of product under absorption costing. 2. Calculate the cost of one unit of product under variable costing. 3. Calculate operating income under absorption costing for next year. 4. Calculate operating income under variable costing for next year.arrow_forwardUsing the information in the previous exercises about Marleys Manufacturing, determine the operating income for department B, assuming department A sold department B 1,000 units during the month and department A reduces the selling price to the market price.arrow_forward
- Contribution Margin, Break-Even Sales, Cost-Volume-Profit Chart, Margin of Safety, and Operating Leverage Belmain Co. expects to maintain the same inventories at the end of 20Y7 as at the beginning of the year. The total of all production costs for the year is therefore assumed to be equal to the cost of goods sold. With this in mind, the various department heads were asked to submit estimates of the costs for their departments during the year. A summary report of these estimates is as follows: Estimated Estimated Variable Cost Fixed Cost (per unit sold) Production costs: Direct materials $28 Direct labor 19 Factory overhead $139,800 14 Selling expenses: Sales salaries and commissions 29,000 6 Advertising 9,800 Travel 2,200 Miscellaneous selling expense 2,400 Administrative expenses: orfice and officers' salaries 28,400 Supplies 3,500 2 Miscellaneous administrative expense 3,300 3 Total $218,400 $78 It is expected that 6,300 units will be sold at a price of $156 a unit. Maximum sales…arrow_forwardContribution Margin, Break-Even Sales, Cost-Volume-Profit Chart, Margin of Safety, and Operating Leverage Belmain Co. expects to maintain the same inventories at the end of 20Y7 as at the beginning of the year. The total of all production costs for the year is therefore assumed to be equal to the cost of goods sold. With this in mind, the various department heads were asked to submit estimates of the costs for their departments during the year. A summary report of these estimates is as follows: EstimatedFixedCost EstimatedVariableCost(perunitsold) Production costs: Direct materials $26 Direct labor 17 Factory overhead $564,000 13 Selling expenses: Sales salaries and commissions 117,200 6 Advertising 39,700 Travel 8,800 Miscellaneous selling expense 9,700 5 Administrative expenses: Office and officers' salaries 114,600 Supplies 14,100 2…arrow_forwardContribution Margin, Break-Even Sales, Cost-Volume-Profit Chart, Margin of Safety, and Operating Leverage Belmain Co. expects to maintain the same inventories at the end of 20Y7 as at the beginning of the year. The total of all production costs for the year is therefore assumed to be equal to the cost of goods sold. With this in mind, the various department heads were asked to submit estimates of the costs for their departments during the year. A summary report of these estimates is as follows: EstimatedFixed Cost Estimated Variable Cost(per unit sold) Production costs: Direct materials $13 Direct labor 9 Factory overhead $212,900 6 Selling expenses: Sales salaries and commissions 44,200 3 Advertising 15,000 Travel 3,300 Miscellaneous selling expense 3,700 3 Administrative expenses: Office and officers' salaries 43,200 Supplies 5,300 1…arrow_forward
- Contribution Margin, Break-Even Sales, Cost-Volume-Profit Chart, Margin of Safety, and Operating Leverage Belmain Co. expects to maintain the same inventories at the end of 20Y7 as at the beginning of the year. The total of all production costs for the year is therefore assumed to be equal to the cost of goods sold. With this in mind, the various department heads were asked to submit estimates of the costs for their departments during the year. A summary report of these estimates is as follows: EstimatedFixedCost EstimatedVariableCost(perunitsold) Production costs: Direct materials $17 Direct labor 12 Factory overhead $909,300 9 Selling expenses: Sales salaries and commissions 189,000 4 Advertising 63,900 Travel 14,200 Miscellaneous selling expense 15,600 3 Administrative expenses: Office and officers' salaries 184,700 Supplies 22,700…arrow_forwardContribution Margin, Break-Even Sales, Cost-Volume-Profit Chart, Margin of Safety, and Operating Leverage Belmain Co. expects to maintain the same inventories at the end of 20Y7 as at the beginning of the year. The total of all production costs for the year is therefore assumed to be equal to the cost of goods sold. With this in mind, the various department heads were asked to submit estimates of the costs for their departments during the year. A summary report of these estimates is as follows: EstimatedFixed Cost Estimated Variable Cost(per unit sold) Production costs: Direct materials — $22 Direct labor — 14 Factory overhead $190,100 11 Selling expenses: Sales salaries and commissions 39,500 5 Advertising 13,400 — Travel 3,000 — Miscellaneous selling expense 3,300 4 Administrative expenses: Office and officers' salaries 38,600 — Supplies 4,800…arrow_forwardContribution Margin, Break-Even Sales, Cost-Volume-Profit Chart, Margin of Safety, and Operating Leverage Belmain Co. expects to maintain the same inventories at the end of 20Y7 as at the beginning of the year. The total of all production costs for the year is therefore assumed to be equal to the cost of goods sold. With this in mind, the various department heads were asked to submit estimates of the costs for their departments during the year. A summary report of these estimates is as follows: EstimatedFixedCost EstimatedVariableCost(perunitsold) Production costs: Direct materials $22 Direct labor 14 Factory overhead $514,300 11 Selling expenses: Sales salaries and commissions 106,900 5 Advertising 36,200 Travel 8,000 Miscellaneous selling expense 8,800 4 Administrative expenses: Office and officers' salaries 104,500 Supplies 12,900 2…arrow_forward
- Contribution Margin, Break-Even Sales, Cost-Volume-Profit Chart, Margin of Safety, and Operating Leverage Belmain Co. expects to maintain the same inventories at the end of 20Y7 as at the beginning of the year. The total of all production costs for the year is therefore assumed to be equal to the cost of goods sold. With this in mind, the various department heads were asked to submit estimates of the costs for their departments during the year. A summary report of these estimates is as follows: EstimatedFixed Cost Estimated Variable Cost(per unit sold) Production costs: Direct materials — $24 Direct labor — 16 Factory overhead $538,100 12 Selling expenses: Sales salaries and commissions 111,800 5 Advertising 37,800 — Travel 8,400 — Miscellaneous selling expense 9,200 4 Administrative expenses: Office and officers' salaries 109,300 — Supplies 13,500…arrow_forwardContribution Margin, Break-Even Sales, Cost-Volume-Profit Chart, Margin of Safety, and Operating Leverage Belmain Co. expects to maintain the same inventories at the end of 20Y7 as at the beginning of the year. The total of all production costs for the year is therefore assumed to be equal to the cost of goods sold. With this in mind, the various department heads were asked to submit estimates of the costs for their departments during the year. A summary report of these estimates is as follows: EstimatedFixedCost EstimatedVariableCost(perunitsold) Production costs: Direct materials $13 Direct labor 9 Factory overhead $210,100 6 Selling expenses: Sales salaries and commissions 43,700 3 Advertising 14,800 Travel 3,300 Miscellaneous selling expense 3,600 3 Administrative expenses: Office and officers' salaries 42,700 Supplies 5,300 1…arrow_forwardContribution Margin, Break-Even Sales, Cost-Volume-Profit Chart, Margin of Safety, and Operating Leverage Belmain Co. expects to maintain the same inventories at the end of 20Y7 as at the beginning of the year. The total of all production costs for the year is therefore assumed to be equal to the cost of goods sold. With this in mind, the various department heads were asked to submit estimates of the costs for their departments during the year. A summary report of these estimates is as follows: EstimatedFixed Cost Estimated Variable Cost(per unit sold) Production costs: Direct materials — $26 Direct labor — 17 Factory overhead $265,400 13 Selling expenses: Sales salaries and commissions 55,200 6 Advertising 18,700 — Travel 4,100 — Miscellaneous selling expense 4,600 5 Administrative expenses: Office and officers' salaries 53,900 — Supplies 6,600 2…arrow_forward
 Managerial AccountingAccountingISBN:9781337912020Author:Carl Warren, Ph.d. Cma William B. TaylerPublisher:South-Western College Pub
 Managerial Accounting: The Cornerstone of Busines...AccountingISBN:9781337115773Author:Maryanne M. Mowen, Don R. Hansen, Dan L. HeitgerPublisher:Cengage Learning
 Financial And Managerial AccountingAccountingISBN:9781337902663Author:WARREN, Carl S.Publisher:Cengage Learning,
 College Accounting, Chapters 1-27AccountingISBN:9781337794756Author:HEINTZ, James A.Publisher:Cengage Learning,
 Principles of Accounting Volume 2AccountingISBN:9781947172609Author:OpenStaxPublisher:OpenStax College