
Videos
Section 1
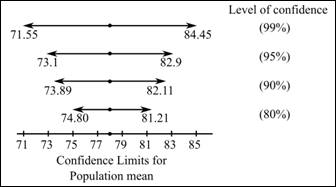
To graph: The diagram that illustrates the effect of the confidence level on the width of the interval.
Section 1
Explanation of Solution
Calculation: The confidence intervals based on different sample sizes need to be determined in order to draw the required diagram. The lower and upper bounds of the confidence interval for the population mean
And,
Where
And,
Therefore, the required confidence interval is
For a confidence level of
And,
Therefore, the required confidence interval is
And,
Therefore, the required confidence interval is
And,
Therefore, the required confidence interval is
Graph:
Section 2
To explain: The results.
Section 2
Answer to Problem 14E
Solution: The width of the confidence interval expands due to hike in the level of confidence.
Explanation of Solution
Want to see more full solutions like this?
Chapter 6 Solutions
Introduction to the Practice of Statistics


 MATLAB: An Introduction with ApplicationsStatisticsISBN:9781119256830Author:Amos GilatPublisher:John Wiley & Sons Inc
 Probability and Statistics for Engineering and th...StatisticsISBN:9781305251809Author:Jay L. DevorePublisher:Cengage Learning
 Statistics for The Behavioral Sciences (MindTap C...StatisticsISBN:9781305504912Author:Frederick J Gravetter, Larry B. WallnauPublisher:Cengage Learning
 Elementary Statistics: Picturing the World (7th E...StatisticsISBN:9780134683416Author:Ron Larson, Betsy FarberPublisher:PEARSON
 The Basic Practice of StatisticsStatisticsISBN:9781319042578Author:David S. Moore, William I. Notz, Michael A. FlignerPublisher:W. H. Freeman
 Introduction to the Practice of StatisticsStatisticsISBN:9781319013387Author:David S. Moore, George P. McCabe, Bruce A. CraigPublisher:W. H. Freeman