
Concept explainers
a)
To construct: A
Introduction: Quality is a measure of excellence or a state of being free from deficiencies, defects and important variations. It is obtained by consistent and strict commitment to certain standards to attain uniformity of a product to satisfy consumers’ requirement.
a)
Answer to Problem 12P
Explanation of Solution
Given information:
| Sample | Mean | Sample | Mean | Sample | Mean | Sample | Mean |
| 1 | 3.86 | 11 | 3.88 | 21 | 3.84 | 31 | 3.88 |
| 2 | 3.90 | 12 | 3.86 | 22 | 3.82 | 32 | 3.76 |
| 3 | 3.83 | 13 | 3.88 | 23 | 3.89 | 33 | 3.83 |
| 4 | 3.81 | 14 | 3.81 | 24 | 3.86 | 34 | 3.77 |
| 5 | 3.84 | 15 | 3.83 | 25 | 3.88 | x35 | 3.86 |
| 6 | 3.83 | 16 | 3.86 | 26 | 3.90 | 36 | 3.80 |
| 7 | 3.87 | 17 | 3.82 | 27 | 3.81 | 37 | 3.84 |
| 8 | 3.88 | 18 | 3.86 | 28 | 3.86 | 38 | 3.79 |
| 9 | 3.84 | 19 | 3.84 | 29 | 3.98 | 39 | 3.85 |
| 10 | 3.80 | 20 | 3.87 | 30 | 3.96 |
Formula:
Calculation of control limits and construction of
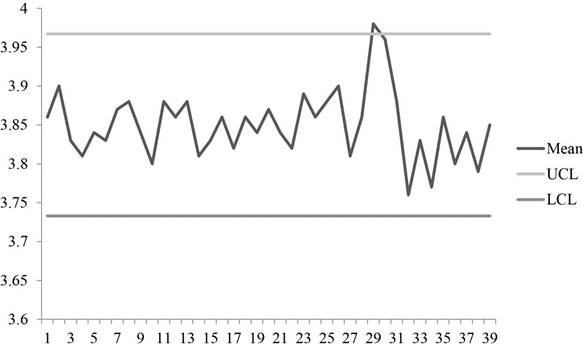
Graph shows the plot for sample means with UCL and LCL values. It can be observed that some points are above the control limits. So, the process is out of control.
Hence, the process is not in control.
b)
To analyze: The data using median run test and up and down run test and conclude the results.
Introduction: Quality is a measure of excellence or a state of being free from deficiencies, defects and important variations. It is obtained by consistent and strict commitment to certain standards to attain uniformity of a product to satisfy consumers’ requirement.
b)
Answer to Problem 12P
Explanation of Solution
Given information:
| Sample | Mean | Sample | Mean | Sample | Mean | Sample | Mean |
| 1 | 3.86 | 11 | 3.88 | 21 | 3.84 | 31 | 3.88 |
| 2 | 3.90 | 12 | 3.86 | 22 | 3.82 | 32 | 3.76 |
| 3 | 3.83 | 13 | 3.88 | 23 | 3.89 | 33 | 3.83 |
| 4 | 3.81 | 14 | 3.81 | 24 | 3.86 | 34 | 3.77 |
| 5 | 3.84 | 15 | 3.83 | 25 | 3.88 | x35 | 3.86 |
| 6 | 3.83 | 16 | 3.86 | 26 | 3.90 | 36 | 3.80 |
| 7 | 3.87 | 17 | 3.82 | 27 | 3.81 | 37 | 3.84 |
| 8 | 3.88 | 18 | 3.86 | 28 | 3.86 | 38 | 3.79 |
| 9 | 3.84 | 19 | 3.84 | 29 | 3.98 | 39 | 3.85 |
| 10 | 3.80 | 20 | 3.87 | 30 | 3.96 |
Formula:
Analysis of data:
To make analysis of data, the given data is compared with median 3.85 to make A/B and U/D.
| Sample | A/B | Mean | U/D | Sample | A/B | Mean | U/D |
| 1 | A | 3.86 | - | 21 | B | 3.84 | D |
| 2 | A | 3.90 | U | 22 | B | 3.82 | D |
| 3 | B | 3.83 | D | 23 | A | 3.89 | U |
| 4 | B | 3.81 | D | 24 | A | 3.86 | D |
| 5 | B | 3.84 | U | 25 | A | 3.88 | U |
| 6 | B | 3.83 | D | 26 | A | 3.90 | U |
| 7 | A | 3.87 | U | 27 | B | 3.81 | D |
| 8 | A | 3.88 | U | 28 | A | 3.86 | U |
| 9 | B | 3.84 | D | 29 | A | 3.98 | U |
| 10 | B | 3.80 | D | 30 | A | 3.96 | D |
| 11 | A | 3.88 | U | 31 | A | 3.88 | D |
| 12 | A | 3.86 | D | 32 | B | 3.76 | D |
| 13 | A | 3.88 | U | 33 | B | 3.83 | U |
| 14 | B | 3.81 | D | 34 | B | 3.77 | D |
| 15 | B | 3.83 | U | 35 | A | 3.86 | U |
| 16 | A | 3.86 | U | 36 | B | 3.80 | D |
| 17 | B | 3.82 | D | 37 | B | 3.84 | U |
| 18 | A | 3.86 | U | 38 | B | 3.79 | D |
| 19 | B | 3.84 | D | 39 | B | 3.85 | U |
| 20 | A | 3.87 | U |
Sample 39 ties with the median and in order to maximize the Ztest statistics, the sample 39 is labeled as B. Therefore, the observed number of runs is 18.
Median run test:
Calculation of expected number of runs:
The expected number of runs is calculated by adding half of the total number of samples with 1 which gives 20.5.
Calculation of standard deviation:
Standard deviation is calculated by subtracting number of sample 39 from 1 and dividing the resultant by 4 and taking square for the value which yields 3.08.
The z factor for median is calculated by dividing the difference of 18 and 20.5 with 3.08 which yields -0.81 which is within the test statistics of ±2.
Up/Down Test:
The observed number of runs from the analysis is 29.
Calculation of expected number of runs:
The expected number of runs is calculated by subtracting the double of the number of samples 39 and subtracting from1 and dividing the resultant with 3 which gives 25.7.
Calculation of standard deviation:
Standard deviation is calculated by multiplying the number of samples with 16 and subtracting the resultant from 29 and then dividing the resulting value with 90 and taking square root which yields 2.57.
The z factor for median is calculated by dividing the difference of 29 and 25.7 with 2.57 which yields +1.28 which is within the test statistics of ±2.
Hence, the results of the median run test and up/down test is random and no non randomness is detected.
Want to see more full solutions like this?
Chapter 10 Solutions
Operations Management


- Describe how to construct process control charts and use them to determine whether a process is out of statistical control.arrow_forward1. The data shown in Table 1 are x and R values for 20 samples of size n= 5 taken from a process producing bearings. The measurements are made on the inside diameter of the bearing, with only the last three decimals recorded (i.e., 31.6 should be 0.50316). Please show all your work for full credit. (a) Set up x and R charts on this process. Does the process seem to be in statistical control? If necessary, revise the trial control limits. (b) Assume that diameter is normally distributed. Estimate the process standard deviation. Sample R Sample R 1 31.6 4 11 29.8 4 33.0 3 12 34.0 4 35.0 4 13 33.0 10 4 32.2 4 14 34.8 4 5 33.8 38.4 31.6 15 35.6 7 3 16 30.8 7 4 17 33.0 5 8 36.8 10 18 31.6 3 9. 35.0 15 19 28.2 9 10 34.0 6 20 33.8 Table 1: Bearing Diameter Dataarrow_forwardA Quality Analyst wants to construct a control chart for determining whether three machines, all producing the same product, are under control with regard to a particular quality variable. Accordingly, he sampled four units of output from each machine, with the following results: Machine Measurements #1 17 15 15 17 #2 16 25 18 25 # 3 23 24 23 22 What is the estimate of the process mean for whenever it is under control? What is the sample average range based upon this limited sample? What are the x-bar chart upper and lower control limits?arrow_forward
- Administering new bank accounts is intended to average 15 minutes each. Five samples of four observations each have been taken. Use the sample data in concurrence with Table 2.3 to create upper and lower control limits for both a mean chart and a range chart. Do results propose that the procedure is in control? Sample 1 Sample 2 Sample 3 Sample 4 Sample 5 11.2 11.3 10.7 10.9 10.8 10.9 10.8 10.9 11.3 11.2 10.8 10.9 10.9 11.1 11.3 11.1 11.4 11.1 11.5 10.7 Total: 44 44.4 43.6 44.8 44arrow_forwarddiscuss how to construct process control chart and use them to determine whether a process is out of statistical control?arrow_forwardWhy is it important to prove that a process is proven capable before developing statistical control limits (i.e., SPC charts)?arrow_forward
- Auto pistons at Wemming Chung's plant in Shanghai are produced in a forging process, and the diameter is a critical factor that must be controlled. From sample sizes of 5 pistons produced each day, the mean and the range of this diameter have been as follows: Day Mean (mm) Range R (mm) 158 4.3 151.2 4.4 155.7 4.2 153.5 4.8 156.6 4.5 What is the UCL using 3-sigma?(round your response to two decimal places). 1. 2. 4.arrow_forwardWhen most processes are sampled for control chart purposes, why aren't they in statistical control?arrow_forwardYou are an analyst for a company that produces parts for medical devices, and these parts must meet specifications required by your customer. You implement a process improvement to decrease the variation in diameter for one of the parts, and want to determine if the process improvement had any effect. What type of control chart would be most appropriate to determine if the process improvement did in fact reduce variation in the output of the process? Group of answer choices a X-bar b R c P d C e Cpkarrow_forward
- The overall average on a process you are attempting to monitor is 60.0 units. The process population standard deviation is 1.72. Sample size is given to be 4. Part 2 a) Determine the 3-sigma x-chart control limits. Upper Control Limit (UCLx)=enter your response here units (round your response to two decimal places). Part 3 Lower Control Limit (LCLx)=enter your response here units (round your response to two decimal places). Part 4 b) Now determine the 2-sigma x-chart control limits. Upper Control Limit (UCLx)=enter your response here units (round your response to two decimal places). Part 5 Lower Control Limit (LCLx)=enter your response here units (round your response to two decimal places). Part 6 How do the control limits change? A. The control limits are tighter for the 3-sigma x-chart than for the 2-sigma x-chart. B. The control limits for the 2-sigma x-chart and for the 3-sigma x-chart are the same. C. The control limits…arrow_forward1. The overall average on a process you are attempting to monitor is 55.0 units. The process population standard deviation is 1.84. Sample size is given to be 16. a) Determine the 3-sigma x-chart control limits. Upper Control Limit (UCLx)=56.3856.38 units (round your response to two decimal places). Lower Control Limit (LCLx)=53.6253.62 units (round your response to two decimal places). b) Now determine the 2-sigma x-chart control limits. Upper Control Limit (UCLx)=? units (round your response to two decimal places). 2. Sample Size, n Mean Factor, A2 Upper Range, D4 Lower Range, D3 2 1.880 3.268 0 3 1.023 2.574 0 4 0.729 2.282 0 5 0.577 2.115 0 6 0.483 2.004 0 7 0.419 1.924 0.076 8 0.373 1.864 0.136 9 0.337 1.816 0.184 10 0.308 1.777 0.223 12 0.266 1.716 0.284 Thirty-five samples of size 7 each were taken from a…arrow_forwardA process considered to be in control measures an ingredient in ounces. A quality inspector took 10 samples, each with 5 observations as follows: Using this information, obtain three-sigma (i.e., z=3) control limits for a mean control chart and control limits for a range chart, respectively. It is known from previous experience that the standard deviation of the process is 1.36. Discuss whether the process is in control or not.arrow_forward
 Practical Management ScienceOperations ManagementISBN:9781337406659Author:WINSTON, Wayne L.Publisher:Cengage,
 Operations ManagementOperations ManagementISBN:9781259667473Author:William J StevensonPublisher:McGraw-Hill Education
 Operations and Supply Chain Management (Mcgraw-hi...Operations ManagementISBN:9781259666100Author:F. Robert Jacobs, Richard B ChasePublisher:McGraw-Hill Education
 Purchasing and Supply Chain ManagementOperations ManagementISBN:9781285869681Author:Robert M. Monczka, Robert B. Handfield, Larry C. Giunipero, James L. PattersonPublisher:Cengage Learning
 Production and Operations Analysis, Seventh Editi...Operations ManagementISBN:9781478623069Author:Steven Nahmias, Tava Lennon OlsenPublisher:Waveland Press, Inc.