
Concept explainers
Videos
(a)
To explain: about the dots in
(a)
Answer to Problem 40E
The dot above
Explanation of Solution
Given:
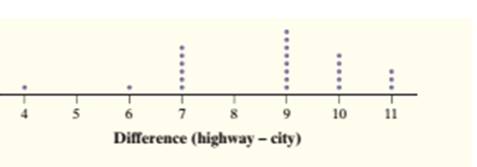
The dot-plot displays the difference (highway-city) in EPA mileage ratings for each of the
(b)
To explain: about fuel economy versus the car models on the highway
(b)
Answer to Problem 40E
The graph tells that the highway has better EPA mileage as compare to city. The fuel economy is better on highway than in city.
Explanation of Solution
The graph tells that the highway has better EPA mileage as compare to city. The fuel economy is better on highway than in city.
Chapter 1 Solutions
The Practice of Statistics for AP - 4th Edition
Additional Math Textbook Solutions
Basic Business Statistics, Student Value Edition (13th Edition)
Elementary Statistics
Introductory Statistics
Introductory Statistics
Essentials of Statistics, Books a la Carte Edition (5th Edition)
Essentials of Statistics (6th Edition)


 MATLAB: An Introduction with ApplicationsStatisticsISBN:9781119256830Author:Amos GilatPublisher:John Wiley & Sons Inc
 Probability and Statistics for Engineering and th...StatisticsISBN:9781305251809Author:Jay L. DevorePublisher:Cengage Learning
 Statistics for The Behavioral Sciences (MindTap C...StatisticsISBN:9781305504912Author:Frederick J Gravetter, Larry B. WallnauPublisher:Cengage Learning
 Elementary Statistics: Picturing the World (7th E...StatisticsISBN:9780134683416Author:Ron Larson, Betsy FarberPublisher:PEARSON
 The Basic Practice of StatisticsStatisticsISBN:9781319042578Author:David S. Moore, William I. Notz, Michael A. FlignerPublisher:W. H. Freeman
 Introduction to the Practice of StatisticsStatisticsISBN:9781319013387Author:David S. Moore, George P. McCabe, Bruce A. CraigPublisher:W. H. Freeman