
Cornerstones of Financial Accounting
4th Edition
ISBN: 9781337690881
Author: Jay Rich, Jeff Jones
Publisher: Cengage Learning
expand_more
expand_more
format_list_bulleted
Videos
Textbook Question
Chapter 12, Problem 87PSA
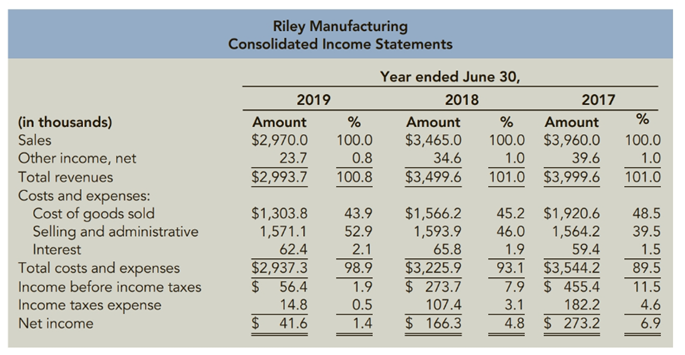
A Using Common Size Statements
The following income statement and vertical analysis data are available for Riley
Manufacturing:
Required:
1. CONCEPTUAL CONNECTION Suggest why net income declined from $273,200 to $41,600 while the cost of goods sold percentage decreased each year and selling and administrative expenses remained nearly constant.
2. CONCEPTUAL CONNECTION Determine what could cause sales to decline while the gross margin percentage increases.
Expert Solution & Answer

Trending nowThis is a popular solution!

Students have asked these similar questions
Refer to the information for Jasper Company on the previous page.Required:1. Prepare an income statement for Jasper for last year. Calculate the percentage of sales for eachline item on the income statement. (Note: Round percentages to the nearest tenth of a percent.)2. CONCEPTUAL CONNECTION Briefly explain how a manager could use the incomestatement created for Requirement 1 to better control costs.
a. Present a cost-profit-volume analysis that shows the effect of adding the $8,500 annual
premium to the company's fixed costs by showing current and revised CVP Income Statements.
Include a column to the right of each income statement where each line item is expressed as a
percentage of sales (called a common size income statement).
b. Visualize the changes to net income in a chart.
c. Advise the company using your quantitative support and qualitative. reasoning as to whether
the company should purchase the insurance.
A-Float Pools Company
Income Statement (Pools Maintenance Div.)
For the Year Ended December 31, 2022
In
Sales (2,000 clients)
Cost of Services
Gross profit
Operating expenses
Selling
Administrative
Net Income
$165,000
$225,000
$1,100,000
627,000
$473,000
$390,000
$83.000
Which of the following is true regarding the contribution margin ratio of asingle product company?
a. As fixed expenses decrease, the contribution margin ratio increases
b. The contribution margin ratio increases as the number of units sold increase
c. The contribution margin ratio multiplied by the variable expense per unit equals thecontribution margin per unit
d. If sales increase, the peso increase in net operating income can be computed bymultiplying the contribution margin ratio by the peso increase in sales
Chapter 12 Solutions
Cornerstones of Financial Accounting
Ch. 12 - Describe how some of the primary groups of users...Ch. 12 - Prob. 2DQCh. 12 - Prob. 3DQCh. 12 - Prob. 4DQCh. 12 - Prob. 5DQCh. 12 - Prob. 6DQCh. 12 - Prob. 7DQCh. 12 - Prob. 8DQCh. 12 - Prob. 9DQCh. 12 - Prob. 10DQ
Ch. 12 - Prob. 11DQCh. 12 - 12. Why are higher asset turnover ratios...Ch. 12 - Prob. 13DQCh. 12 - Prob. 14DQCh. 12 - Prob. 15DQCh. 12 - Prob. 16DQCh. 12 - Which of the following use financial statement...Ch. 12 - Prob. 2MCQCh. 12 - Prob. 3MCQCh. 12 - Prob. 4MCQCh. 12 - Prob. 5MCQCh. 12 - Prob. 6MCQCh. 12 - Prob. 7MCQCh. 12 - Which type of analysis compares a single...Ch. 12 - Which of the following types of analysis compares...Ch. 12 - Which of the following types of analysis is...Ch. 12 - Prob. 11MCQCh. 12 - Prob. 12MCQCh. 12 - Prob. 13MCQCh. 12 - Partial information from Fabray Companys balance...Ch. 12 - Hummel Inc. has $30,000 in current assets and...Ch. 12 - Prob. 16MCQCh. 12 - A firms quick ratio is typically computed as: a....Ch. 12 - Prob. 18MCQCh. 12 - Prob. 19MCQCh. 12 - Prob. 20MCQCh. 12 - Prob. 21MCQCh. 12 - Prob. 22MCQCh. 12 - Prob. 23MCQCh. 12 - When analyzing a companys debt to equity ratio,...Ch. 12 - Prob. 25MCQCh. 12 - Prob. 26MCQCh. 12 - Prob. 27MCQCh. 12 - Prob. 28MCQCh. 12 - Prob. 29MCQCh. 12 - Prob. 30MCQCh. 12 - Which of the following ratios is used to measure...Ch. 12 - Prob. 32MCQCh. 12 - Selected information for Berry Company is as...Ch. 12 - Which of the following ratios is used to measure a...Ch. 12 - Prob. 35MCQCh. 12 - Prob. 36MCQCh. 12 - Prob. 37MCQCh. 12 - Prob. 38MCQCh. 12 - Which of the following are not part of common...Ch. 12 - Prob. 40MCQCh. 12 - Prob. 41MCQCh. 12 - Prob. 42MCQCh. 12 - Which of the following is not included in the...Ch. 12 - When a Dupont analysis reveals that a company has...Ch. 12 - Prob. 45MCQCh. 12 - Cross Sectional Analysis Cross sectional analysis...Ch. 12 - Prob. 47CECh. 12 - Prob. 48CECh. 12 - Short-Term Liquidity Ratios Three ratios...Ch. 12 - Debt Management Ratios Selected data from the...Ch. 12 - Debt Management and Short-Term Liquidity Ratios...Ch. 12 - Asset Efficiency Ratios Selected financial...Ch. 12 - Profitability Ratios The following data came from...Ch. 12 - Prob. 54CECh. 12 - Prob. 55CECh. 12 - Prob. 56CECh. 12 - Prob. 57BECh. 12 - Prob. 58BECh. 12 - Prob. 59BECh. 12 - Short-Term Liquidity Ratios Larry, Curly, and Moe...Ch. 12 - Debt Management Ratios Glow Corporation provides...Ch. 12 - Debt Management and Short-Term Liquidity Ratios...Ch. 12 - Asset Efficiency Ratios Rumsford Inc.s financial...Ch. 12 - Prob. 64BECh. 12 - Profitability Ratios Tinker Corporation operates...Ch. 12 - Profitability Ratios Katrina Corp. is a publicly...Ch. 12 - Prob. 67BECh. 12 - Prob. 68ECh. 12 - Prob. 69ECh. 12 - Prob. 70ECh. 12 - Prob. 71ECh. 12 - Horizontal Analysis of Income Statements...Ch. 12 - Prob. 73ECh. 12 - Prob. 74ECh. 12 - Prob. 75ECh. 12 - Prob. 76ECh. 12 - Prob. 77ECh. 12 - Prob. 78ECh. 12 - Prob. 79ECh. 12 - Asset Efficiency Ratios Refer to financial...Ch. 12 - Prob. 81ECh. 12 - Prob. 82ECh. 12 - Prob. 83ECh. 12 - Prob. 84PSACh. 12 - Prob. 85PSACh. 12 - Prob. 86PSACh. 12 - A Using Common Size Statements The following...Ch. 12 - Prob. 88PSACh. 12 - Prob. 89PSACh. 12 - Prob. 90PSACh. 12 - A Comparing Financial Ratios Presented below are...Ch. 12 - A Preparation of Ratios Refer to the financial...Ch. 12 - Accounting Alternatives and Financial Analysis...Ch. 12 - Prob. 84PSBCh. 12 - Prob. 85PSBCh. 12 - Prob. 86PSBCh. 12 - Prob. 87PSBCh. 12 - Prob. 88PSBCh. 12 - Prob. 89PSBCh. 12 - Prob. 90PSBCh. 12 - Comparing Financial Ratios Presented below are...Ch. 12 - Prob. 92PSBCh. 12 - Problem 1 2-93B Accounting Alternatives and...Ch. 12 - Prob. 94CCh. 12 - Prob. 95.1CCh. 12 - Prob. 95.2CCh. 12 - Prob. 96.1CCh. 12 - Prob. 96.2CCh. 12 - Prob. 97.1CCh. 12 - Prob. 97.2CCh. 12 - Prob. 97.3CCh. 12 - Prob. 97.4CCh. 12 - Analyzing Growth Consolidated financial statements...Ch. 12 - Analyzing Growth Consolidated financial statements...Ch. 12 - Prob. 98.1CCh. 12 - Prob. 98.2CCh. 12 - Prob. 98.3CCh. 12 - CONTINUING PROBLEM: FRONT ROW ENTERTAINMENT The...Ch. 12 - Prob. 99.2CCh. 12 - Prob. 99.3CCh. 12 - Prob. 99.4CCh. 12 - Prob. 99.5C
Knowledge Booster


Learn more about
Need a deep-dive on the concept behind this application? Look no further. Learn more about this topic, accounting and related others by exploring similar questions and additional content below.Similar questions
- Margin, Turnover, Return on Investment, Average Operating Assets Elway Company provided the following income statement for the last year: At the beginning of last year, Elway had 28,300,000 in operating assets. At the end of the year, Elway had 23,700,000 in operating assets. Required: 1. Compute average operating assets. 2. Compute the margin and turnover ratios for last year. (Note: Round the answer for margin ratio to two decimal places.) 3. Compute ROI. (Note: Round answer to two decimal places.) 4. CONCEPTUAL CONNECTION Briefly explain the meaning of ROI. 5. CONCEPTUAL CONNECTION Comment on why the ROI for Elway Company is relatively high (as compared to the lower ROI of a typical manufacturing company).arrow_forwardA condensed income statement for Corolla Corporation and a partially completed vertical analysis are presented below. Required: 1. Complete the vertical analysis by computing each missing line item as a percentage of sales revenues. 2. Does Corolla's Cost of Goods sold for the current year, as a percentage of revenues, represent better or worse performance as compared to that for the previous year? 3. Has Corolla"s net profit margin increased, or decreased, over the two years? Complete this question by entering your answers in the tabs below. Required 1 Required 2 Required 3 Complete the vertical analysis by computing each missing line item as a percentage of sales revenues. (Round your answers to the nearest whole percent.) COROLLA CORPORATION Income Statement (summarized) (in millions of U.S. dollars) Current Year Previous Year Sales Revenues $ 2,085 100 % $ 2,155 100 % Cost of Goods Sold 1,727 83 % 1,631 % Selling, General, and Administrative Expenses 243 % 310 14 % Other Operating…arrow_forwardQuestion 1 Indicate which one of the following would not appear on both a single-step income statement and a multiple-step income statement. Question 2 Bolton Company’s gross profit rate last year was 32.0% and this year it is 28.4%. Which of the following would not be a possible cause for this decline in the gross profit rate? Question 3 The amount of cost of good available for sale during the year depends on the amounts of Question 4 The Sales Returns and Allowances account does not provide information to management about Question 5 Stan’s Market recorded the following events involving a recent purchase of merchandise: As a result of these events, the company’s merchandise inventory Question 6 Gross profit equals the difference between sales and Question 7 A company using a perpetual inventory system that returns goods previously purchased on credit would Question 8 The collection of a $900 account beyond the 2 percent discount period will result in a Question 9 Expenses…arrow_forward
- 1. Compute the companywide break-even point in dollar sales. 2. Compute the break-even point in dollar sales for the East region. 3. Compute the break-even point in dollar sales for the West region. 4. Prepare a new segmented income statement based on the break-even dollar sales that you computed in requirements 2 and 3. Use the same format as shown above. What is Crossfire’s net operating income (loss) in your new segmented income statement? 5. Do you think that Crossfire should allocate its common fixed expenses to the East and West regions when computing the break-even points for each region?arrow_forwardTime series analysis involves comparing a company’s income statement and balance sheet forthe current year to its previous years’ income statements and balance sheets.Required:Explain whether it is always bad if a company’s cost of goods sold is increasing from year to year.arrow_forwardPROBLEM 11-17 Return on Investment (ROI) and Residual Income LO11-1, LO11-2 Financial data for Joel de Paris, Inc., for last year follow: Joel de Paris, Inc. Balance Sheet Beginning Ending Balance Balance Assets Cash $ 140,000 $ 120,000 Accounts receivable 450,000 530,000 Inventory 320,000 380,000 Plant and equipment, net 680,000 620,000 Investment in Buisson, S.A. 280,000 170,000 250,000 Land (undeveloped) 180,000 Total assets $2,020,000 $2,100,000 Liabilities and Stockholders' Equity Accounts payable. $ 360,000 $ 310,000 Long-term debt Stockholders' equity 1,500,000 1,500,000 160,000 290,000 Total liabilities and stockholders' equity $2,020,000 $2,100,000 Joel de Paris, Inc. Income Statement Sales $4,050,000 Operating expenses Net operating income 3,645,000 405,000 Interest and taxes: Interest expense $150,000 Таx expense 110,000 260,000 Net income $ 145,000 The company paid dividends of $15,000 last year. The "Investment in Buisson, S.A.," on the balance sheet represents an…arrow_forward
- Ratio analysis of a company’s performance as shown in its profit and loss account may show a decline in profit margin (gross profit as a percentage of sales revenue) compared with the previous period. Required: Give five possible reasons for a decline in gross profit as a percentage of sales revenue from one year to the next, briefly explaining for each why it has the effect of reducing the percentage. Note: You are not required to consider factors, which reduce gross profit itself, only those that reduce the gross profit percentage of sales.arrow_forward1. How would a product life-cycle income statement differ from the above income statements? 2. Prepare a three-year life-cycle income statement for both products. Which product appears to be more profitable and why? 3. Prepare a schedule showing each cost category as a percentage of total annual costs. What do you think this indicates about the profitability of each product over the three-year life cycle?arrow_forwardReturn on Investment (ROI) Analysis The contribution formal income statement for Huerra Company for last year is given below: The company had average operating assets of $2,000,000 during the year. Required: 1. Compute the company’s return on investment (ROI) for the period using the ROI formula stated in terms of margin and turnover. For each of the following questions, indicate whether the margin and turnover will increase, decrease, or remain unchanged as a result of the events described, and then compute the new ROI figure. Consider each question separately, starting in each case from the data used to compute the original ROI in (l) above. 2. Using Lean Production, the company is able to reduce the average level of inventory by $400,000. (The released funds are used to pay off short-term creditors.) 3. The company achieves a cost savings of $32,000 per year by using less costly materials. 4. The company issues bonds and uses the proceeds to purchase machinery and equipment that…arrow_forward
- A condensed income statement for Weber Associates and a partially completed vertical analysis follow. Required: 1. Complete the vertical analysis by computing each missing line item as a percentage of net revenues. TIP: In the prior year, Cost of Goods Sold was 31 percent of Net Revenues, computed as ($1,397 ÷ $4,571). 2. Does Cost of Goods Sold, as a percentage of Net Revenues, represent better or worse performance in 2019 as compared to 2018? Complete this question by entering your answers in the tabs below. Required 1 Required 2 Complete the vertical analysis by computing each missing line item as a percentage of net revenues. TIP: In the prior year, Cost of Goods Sold was 31 percent of Net Revenues, computed as ($1,397 ÷ $4,571). (Decreases should be indicated by a minus sign. Round your answers to the nearest whole percent.) Net Revenues Cost of Goods Sold Research and Development Expense Sales and Marketing Expense General and Administrative Expense Income from Operations Other…arrow_forwardBelow is a list of various metrics used to measure performance. For each metric, identify the correct balanced scorecard perspective with which the metric is associated. Metric Balanced Scorecard Perspective Average stock price Economic value added Employee turnover rates Manufacturing cycle time Market share Number of days from product launch to shelf Number of defects Number of new patent applications Percentage of repeat customers Percentage decrease in operating costs Percentage of sales generated by new products Research and development spending as a percentage of net revenues options: Customer Financial Internal Business Learning and Growtharrow_forwardWhich of the following is true regarding the contribution margin ratio of a single product company? As fixed expenses decrease, the contribution margin ratio increases. The contribution margin ratio multiplied by the variable expense per unit equals the contribution margin per unit. The contribution margin ratio increases as the number of units sold increases. If sales increase, the dollar increase in net operating income can be computed by multiplying the contribution margin ratio by the dollar increase in sales.arrow_forward
arrow_back_ios
arrow_forward_ios
Recommended textbooks for you
 Cornerstones of Financial AccountingAccountingISBN:9781337690881Author:Jay Rich, Jeff JonesPublisher:Cengage Learning
 Managerial Accounting: The Cornerstone of Busines...AccountingISBN:9781337115773Author:Maryanne M. Mowen, Don R. Hansen, Dan L. HeitgerPublisher:Cengage Learning
 Financial And Managerial AccountingAccountingISBN:9781337902663Author:WARREN, Carl S.Publisher:Cengage Learning,
 Managerial AccountingAccountingISBN:9781337912020Author:Carl Warren, Ph.d. Cma William B. TaylerPublisher:South-Western College Pub
 Financial Accounting: The Impact on Decision Make...AccountingISBN:9781305654174Author:Gary A. Porter, Curtis L. NortonPublisher:Cengage Learning
Cornerstones of Financial Accounting
Accounting
ISBN:9781337690881
Author:Jay Rich, Jeff Jones
Publisher:Cengage Learning
Managerial Accounting: The Cornerstone of Busines...
Accounting
ISBN:9781337115773
Author:Maryanne M. Mowen, Don R. Hansen, Dan L. Heitger
Publisher:Cengage Learning
Financial And Managerial Accounting
Accounting
ISBN:9781337902663
Author:WARREN, Carl S.
Publisher:Cengage Learning,
Managerial Accounting
Accounting
ISBN:9781337912020
Author:Carl Warren, Ph.d. Cma William B. Tayler
Publisher:South-Western College Pub
Financial Accounting: The Impact on Decision Make...
Accounting
ISBN:9781305654174
Author:Gary A. Porter, Curtis L. Norton
Publisher:Cengage Learning
Financial ratio analysis; Author: The Finance Storyteller;https://www.youtube.com/watch?v=MTq7HuvoGck;License: Standard Youtube License