Videos
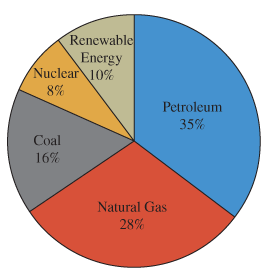
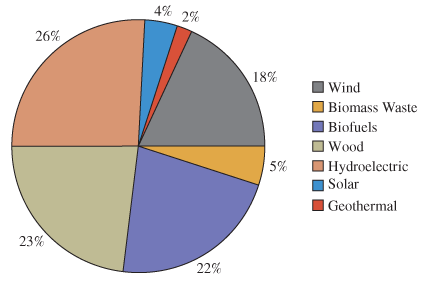
Questions 1-5 use the pie charts below. The first illustrates the percentage of energy consumption in the United States by energy source for 2014. The second illustrates the specific breakdown of different renewable energy sources.
U.S. Energy Consumption by Source
Breakdown of Renewable Energy Sources
The first chart shows that 35% of our energy came from petroleum. The total energy usage for the United States in 2014 was 98.3 quadrillion BTU (British thermal units). What does the result of the calculation
Want to see the full answer?
Check out a sample textbook solution
Chapter 1 Solutions
Pathways To Math Literacy (looseleaf)
Additional Math Textbook Solutions
Mathematics for Elementary Teachers with Activities (5th Edition)
Excursions in Modern Mathematics (9th Edition)
Finite Mathematics & Its Applications (12th Edition)
Mathematics for the Trades: A Guided Approach (10th Edition) - Standalone book
Probability and Statistics for Engineers and Scientists
Mathematics All Around (6th Edition)


 Algebra & Trigonometry with Analytic GeometryAlgebraISBN:9781133382119Author:SwokowskiPublisher:Cengage
 Holt Mcdougal Larson Pre-algebra: Student Edition...AlgebraISBN:9780547587776Author:HOLT MCDOUGALPublisher:HOLT MCDOUGAL
 Mathematics For Machine TechnologyAdvanced MathISBN:9781337798310Author:Peterson, John.Publisher:Cengage Learning,
 Intermediate AlgebraAlgebraISBN:9781285195728Author:Jerome E. Kaufmann, Karen L. SchwittersPublisher:Cengage Learning
 Calculus For The Life SciencesCalculusISBN:9780321964038Author:GREENWELL, Raymond N., RITCHEY, Nathan P., Lial, Margaret L.Publisher:Pearson Addison Wesley,