Videos
Skills and Applications
Sales The graph shows the sales (in billions of dollars) for apple Inc. in the years 2009 through 2015.
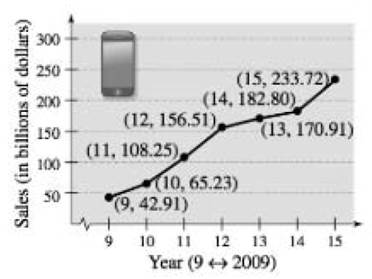
(a) Use the Slopes of the line segments to determine the years in which the sales showed the greatest increase and the least increase.
(b) Find the slopes of the line segment connecting the points for the years 2009 and 2015.
(c) Interpret the meaning of the slope in part (b) in the context of the problem.
Want to see the full answer?
Check out a sample textbook solution
Chapter 1 Solutions
Precalculus (MindTap Course List)


 Trigonometry (MindTap Course List)TrigonometryISBN:9781337278461Author:Ron LarsonPublisher:Cengage Learning
 Holt Mcdougal Larson Pre-algebra: Student Edition...AlgebraISBN:9780547587776Author:HOLT MCDOUGALPublisher:HOLT MCDOUGAL
 Glencoe Algebra 1, Student Edition, 9780079039897...AlgebraISBN:9780079039897Author:CarterPublisher:McGraw Hill
 Intermediate AlgebraAlgebraISBN:9781285195728Author:Jerome E. Kaufmann, Karen L. SchwittersPublisher:Cengage Learning
 Big Ideas Math A Bridge To Success Algebra 1: Stu...AlgebraISBN:9781680331141Author:HOUGHTON MIFFLIN HARCOURTPublisher:Houghton Mifflin Harcourt