
Concept explainers
Videos
Significance of Racing Bike Weight on Price. In exercise 20, data on x = weight (pounds) and y = price ($) for 10 road-racing bikes provided the estimated regression equation
20. Price and Weight of Bicycles. Bicycling, the world’s leading cycling magazine, reviews hundreds of bicycles throughout the year. Their “Road-Race” category contains reviews of bikes used by riders primarily interested in racing. One of the most important factors in selecting a bike for racing is the weight of the bike. The following data show the weight (pounds) and price ($) for 10 racing bikes reviewed by the magazine (Bicycling website).
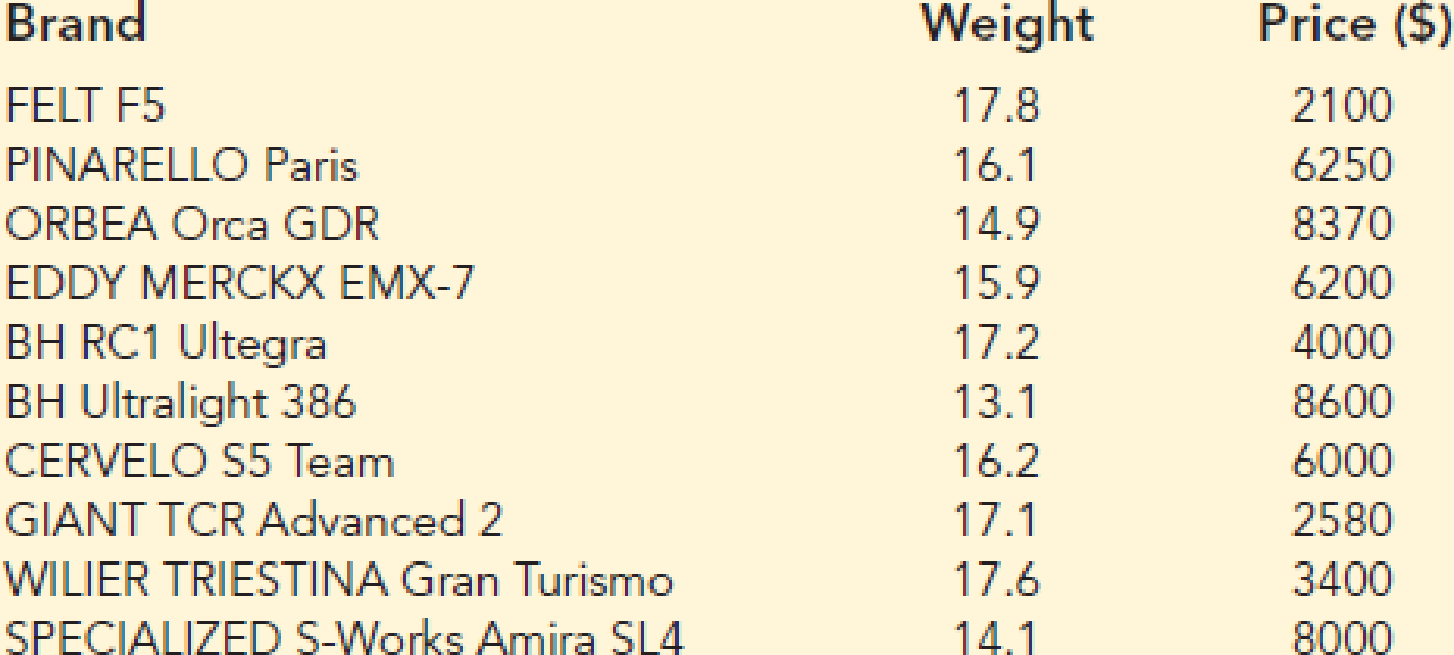
- a. Use the data to develop an estimated regression equation that could be used to estimate the price for a bike given the weight.
- b. Compute r2. Did the estimated regression equation provide a good fit?
- c. Predict the price for a bike that weighs 15 pounds.
Want to see the full answer?
Check out a sample textbook solution
Chapter 14 Solutions
Essentials Of Statistics For Business & Economics


- What is regression analysis? Describe the process of performing regression analysis on a graphing utility.arrow_forwardwhat is the best predicted weight for a bear with 48 inches, and what is the regression equationarrow_forwardMore horsepower In Exercise 2, the regression modelmpg = 46.87 - 0.084 HP relates cars’ horsepower totheir fuel economy (in mpg). Explain what the slopemeans.arrow_forward
- Interpret an R^2 value of 0.62 for a linear regression model where X is the independent variable and Y is the dependent variable.arrow_forwardwhat is the best-predicted weight for a bear with 43 inches, and What is the regression equation?arrow_forwardcreate graph of the two-variable data with a regression line, r, r2, and separate residual plotarrow_forward
- Analysis of the relationship between the fuel economy (combinedMPG) and displacement (in liters) for 1262 models of cars produces the regression model combinedMPH = 33.472 - 3.317Displacement. Explain what the slope means.arrow_forwardYou are attempting to predict grade point average based on the amount a student drinks. You calculate a simple regression and get a slope coefficient (b) of -.15. What does this slope coefficient mean?arrow_forwardWrite out the regression equation based on the output. What happens to exam performance with every increase in exam anxiety and what do you notice about the standardized regression coefficient (Beta) and the correlation?arrow_forward
- Make a sample data about the factors that could be rated to the number of text/chat messages a senior high student/s sends in a day. Make a scenario out of it using the data needed in correlation and regression analysis. Use samples that are less than 30. Lastly, test your claim if it is true and form the regression equation for this scenario.arrow_forwardA frequent flyer was interested in the relationship between dollars spent on flying and the distance flown. She sampled 20 frequent flyers of a certain airline. She collected the number of miles flown in the previous year and the total amount of money the flyer spent. A regression line of distance flown on money spent was fit to the data: y^=24000+10x. One person in the sample spent $3000 and flew 42,567 miles. What would be the residual (or error) in the predicted distance this person would fly?arrow_forwardDescribe about how to place a regression line?arrow_forward
 Glencoe Algebra 1, Student Edition, 9780079039897...AlgebraISBN:9780079039897Author:CarterPublisher:McGraw Hill