Introduction To Statistics And Data Analysis
6th Edition
ISBN: 9781337793612
Author: PECK, Roxy.
Publisher: Cengage Learning,
bartleby

Concept explainers

bartleby

Videos

Question
Book Icon
Chapter 15, Problem 44CR

a.

To determine

Check whether there is evidence that the true average iron content is the same for all four storage periods at 0.05 level of significance.

a.

Expert Solution
Check Mark

Answer to Problem 44CR

There is convincing evidence that the mean average iron content is not same for all four storage periods at 0.05 level of significance.

Explanation of Solution

Calculation:

The given table information is that there are four storage periods and twenty-four containers of maize. These twenty-four containers are divide into four groups with six of each.

The given summary statistics is as follows:

Storage Periodx¯s2
04.9230.000107
14.9230.000067
24.9170.000147
44.9020.000057

It is assumed that μ1,μ2,μ3, and μ4 represents the mean average iron content for the storage period 0, 1, 2, and 4, respectively.

Hypotheses:

Null hypothesis:

H0:μ1=μ2=μ3=μ4.

That is, the mean average iron content does not depend on the storage period.

Alternative hypothesis:

H1: At least two among μ1,μ2,μ3, and μ4 are different.

That is, the mean average iron content depends on the storage period.

Significance level: α=0.05

Test statistic:

F=MSTrMSE

Where, MSTr be the mean sum of squares for treatments and MSE be the mean sum of squares for errors.

The grand mean is calculated as follows:

x¯¯=Grand TotalN=n1x¯1+n2x¯2+n3x¯3+n4x¯4N=6(4.923)+6(4.923)+6(4.917)+6(4.902)24=29.538+29.538+29.502+29.41224=117.9924=4.916

The value of sum of squares for treatments is calculated as follows:

SSTr=n1(x¯1x¯¯)2+n2(x¯2x¯¯)2+n3(x¯3x¯¯)2+n4(x¯4x¯¯)2=6(4.9234.916)2+6(4.9234.916)2+6(4.9174.916)2+6(4.9024.916)2=6(0.000049)+6(0.000049)+6(0.000001)+6(0.000196)=0.000294+0.000294+0.000006+0.001176=0.00177

The value of sum of squares for error is calculated as follows:

SSE=(n11)s12+(n21)s22+(n31)s32+(n41)s42=(61)(0.000107)+(61)(0.000067)+(61)(0.000147)+(61)(0.000057)=5(0.000107)+5(0.000067)+5(0.000147)+5(0.000057)=0.000535+0.000335+0.000735+0.000285=0.00189

The degrees of freedom for treatment is calculated as follows:

df=k1=41=3

The degrees of freedom for error is calculated as follows:

df=Nk=244=20

The value of mean sum of squares for treatments is calculated as follows:

MSTr=SSTrdffor treatments=0.001773=0.00059

The value of mean sum of squares for error is calculated as follows:

MSE=SSEdffor error=0.0018920=0.0000945

The value of the F test statistic is calculated as follows:

F=MSTrMSE=0.000590.0000945=6.24

P-value:

Software procedure:

A step-by-step procedure to find P-value using MINITAB software is as follows:

  • Choose Graph > Probability Distribution Plot choose View Probability > OK.
  • From Distribution, choose ‘F’ distribution.
  • Enter the Numerator df as 3 and Denominator df as 20.
  • Click the Shaded Area tab.
  • Choose X Value and Right Tail for the region of the curve to shade.
  • Enter the X value as 6.24.
  • Click OK.

Output obtained using MINITAB software is as follows:

Introduction To Statistics And Data Analysis, Chapter 15, Problem 44CR , additional homework tip  1

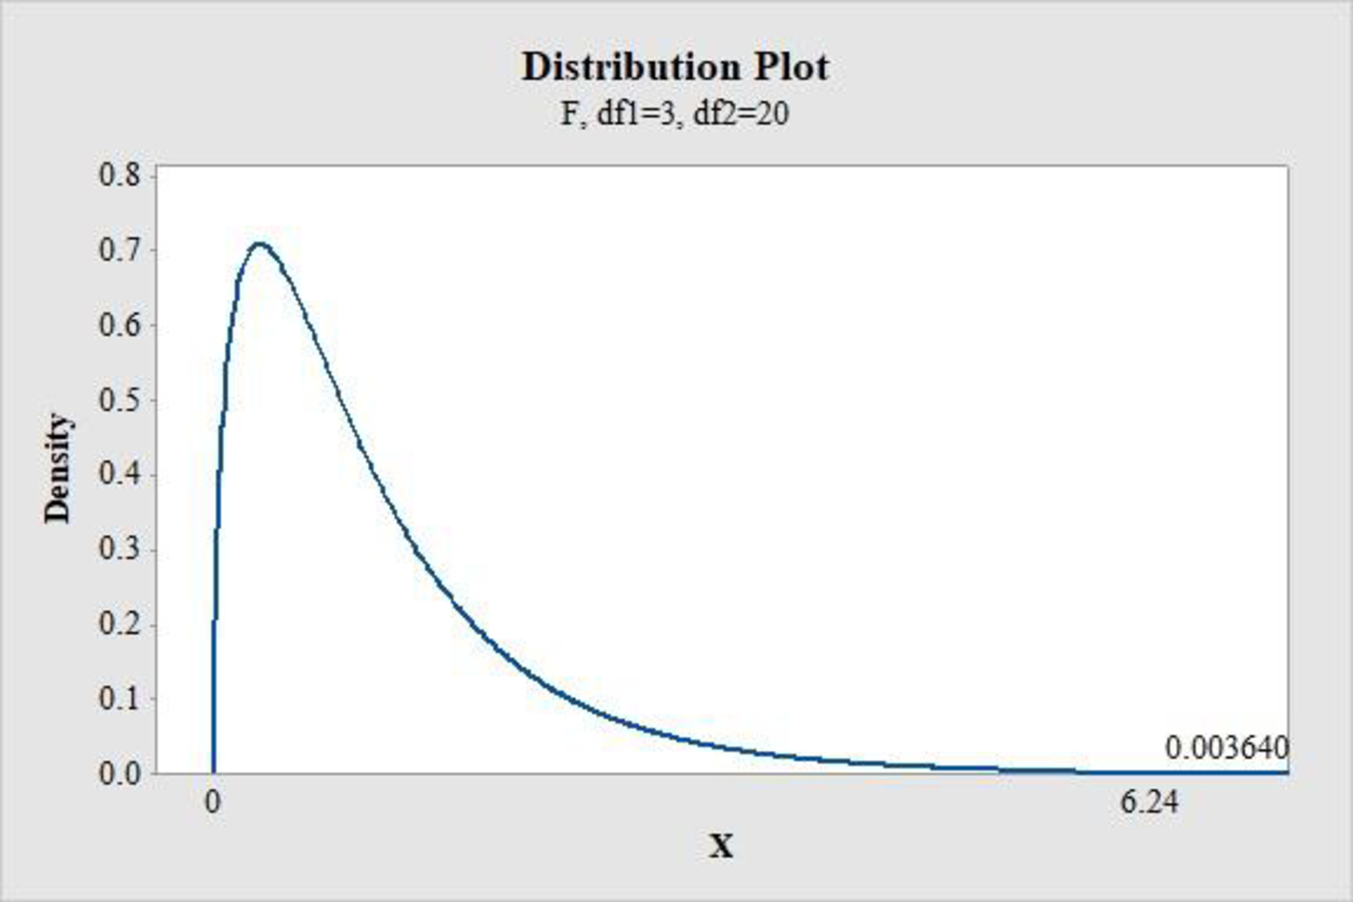
From MINITAB output, the P-value is approximately 0.00364.

Conclusion:

If Pvalueα, then reject the null hypothesis.

Therefore, the P-value of 0.00364 is less than 0.05 (level of significance).

Hence, reject the null hypothesis.

Thus, it can be concluded that there is convincing evidence that the mean average iron content is not the same for all four storage periods at 0.05 level of significance.

b.

To determine

Perform a multiple comparison analysis.

b.

Expert Solution
Check Mark

Explanation of Solution

Calculation:

The formula for the Tukey–Kramer multiple comparison procedure is as follows:

For μ1μ2:(x¯1x¯2)±qMSEl .

Where , x¯1 and x¯2 be the sample means for Treatment 1 and 2, respectively and l be the sample size. Here, q represents the relevant Studentized range critical value and MSE be the mean sum of squares for error.

From APPENDIX: Table 7 Critical Values of q for the Studentized Range Distribution, the critical value for q is noted as follows:

  • Locate the value 20 or the nearest value in the column of Error df.
  • Locate 95% in the column of confidence interval corresponding to the above error df.
  • Locate the value 4 in the row of number of populations, treatments, or levels being compared.
  • The intersecting value that corresponds to the error df 20 at 95% confidence level with 4 treatments is 3.96.

From Part a, the value of MSE is 0.0000945. The sample mean values for storage periods 0,1, 2, and 3 are 4.923, 4.923, 4.917, and 4.902, respectively.

For μ1μ2:

95% T–K intervals for μ1μ2 are calculated as follows:

(x¯1x¯2)±qMSEl=(4.9234.923)±3.960.00009456=0±3.96(0.00001575)=0±3.96(0.0040)=0±0.01584=(0.01584,0.01584)

From the MINITAB output, the 95% Tukey–Kramer confidence intervals for storage group 0 and 1 are (0.01584,0.01584). It includes the value 0 and it can be concluded that storage groups 0 and 1 do not differ from each other.

For μ1μ3:

The 95% T–K interval for μ1μ3 is calculated as follows:           

(x¯1x¯3)±qMSEl=(4.9234.917)±3.960.00009456=0.006±3.96(0.00001575)=0.006±3.96(0.0040)=0.006±0.01584=(0.0060.01584,0.006+0.01584)=(0.00954,0.02184)

From the MINITAB output, the 95% Tukey–Kramer confidence intervals for the storage group 0 and 2 are (0.00954,0.02184). It includes the value 0 and it can be concluded that the storage group 0 and 2 do not differ from each other.

For μ1μ4:

The 95% T–K interval for μ1μ4 is calculated as follows:

(x¯1x¯4)±qMSEl=(4.9234.902)±3.960.00009456=0.021±3.96(0.00001575)=0.021±3.96(0.0040)=0.021±0.01584=(0.0210.01584,0.021+0.01584)=(0.00516,0.03684)

For μ2μ3:

The 95% T–K interval for μ2μ3 is calculated as follows:

(x¯2x¯3)±qMSEl=(4.9234.917)±3.960.00009456=0.006±3.96(0.00001575)=0.006±3.96(0.0040)=0.006±0.01584=(0.0060.01584,0.006+0.01584)=(0.00984,0.02184)

From the MINITAB output, the 95% Tukey–Kramer confidence intervals for the storage group 1 and 2 is (0.00984,0.02184). It includes the value 0 and it can be concluded that the storage groups 2 and 4 do not differ from each other.

For μ2μ4:

The 95% T–K interval for μ2μ4 is calculated as follows:

(x¯2x¯4)±qMSEl=(4.9234.902)±3.960.00009456=0.021±3.96(0.00001575)=0.021±3.96(0.0040)=0.021±0.01584=(0.0210.01584,0.021+0.01584)=(0.00516,0.03684)

From the MINITAB output, the 95% Tukey–Kramer confidence intervals for the storage group 1 and 2 are (0.00984,0.02184). It does not include the value 0 and it can be concluded that storage group 2 and storage group 4 differ from each other.

For μ3μ4:

The 95% T–K intervals for μ3μ4 is calculated as follows:

(x¯3x¯4)±qMSEl=(4.9174.902)±3.960.00009456=0.015±3.96(0.00001575)=0.015±3.96(0.0040)=0.015±0.01584=(0.0150.01584,0.015+0.01584)=(0.00084,0.03084)

From the MINITAB output, the 95% Tukey–Kramer confidence intervals for the storage groups 1 and 2 are (0.00984,0.02184). It includes the value 0 and it can be concluded that the storage group 2 and storage group 4 do not differ from each other.

Summarizing the results of the Tukey–Kramer Procedure:

  1. 1. List the sample means in an increasing order and identify the corresponding population just above the value of each x¯.

Introduction To Statistics And Data Analysis, Chapter 15, Problem 44CR , additional homework tip  2

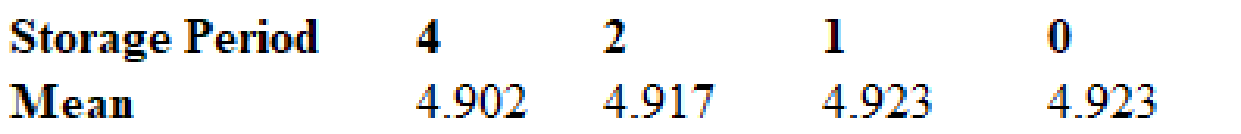
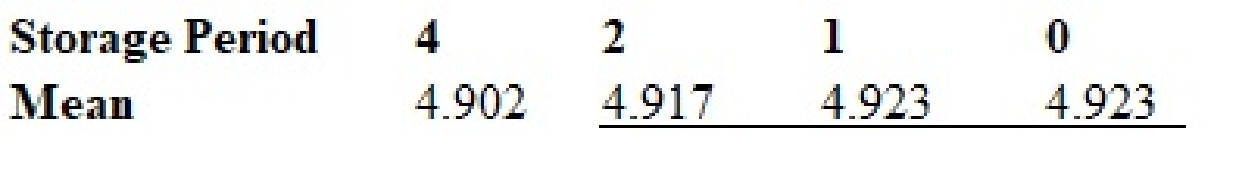
  1. 2. Here, the population mean of storage group 0 does not differ from storage group 1 and storage group 2 but storage group 0 differs from storage group 4. Storage group 1 does not differ from storage group 2. Draw a horizontal line as follows:

Introduction To Statistics And Data Analysis, Chapter 15, Problem 44CR , additional homework tip  3

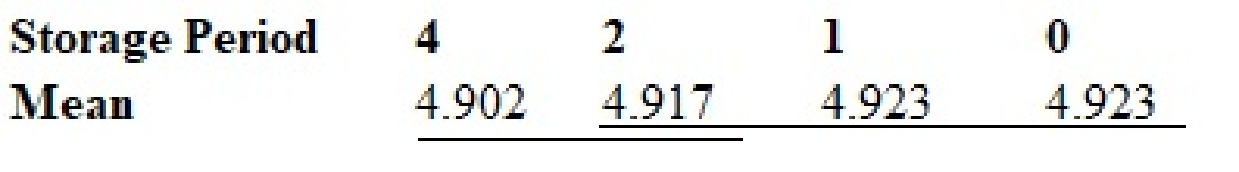
  1. 3. Here, the population mean of storage group 4 does not differ from storage group 2 but storage group 4 differs from storage group 0 and storage group 1. Draw a horizontal line as follows:

Introduction To Statistics And Data Analysis, Chapter 15, Problem 44CR , additional homework tip  4

Want to see more full solutions like this?

Subscribe now to access step-by-step solutions to millions of textbook problems written by subject matter experts!

Chapter 15 Solutions

Introduction To Statistics And Data Analysis

Ch. 15.1 - Prob. 11ECh. 15.1 - In the introduction to this chapter, we considered...Ch. 15.1 - In an experiment to investigate the performance of...Ch. 15.2 - Leaf surface area is an important variable in...Ch. 15.2 - Prob. 15ECh. 15.2 - Prob. 16ECh. 15.2 - Prob. 17ECh. 15.2 - The paper referenced in Exercise 15.5 described an...Ch. 15.2 - Prob. 19ECh. 15.2 - The accompanying data resulted from a flammability...Ch. 15.2 - Do lizards play a role in spreading plant seeds?...Ch. 15.2 - Samples of six different brands of diet or...Ch. 15.3 - A particular county employs three assessors who...Ch. 15.3 - The accompanying display is a partially completed...Ch. 15.3 - With the use of biofuels increasing, investigators...Ch. 15.3 - Prob. 26ECh. 15.3 - Prob. 27ECh. 15.3 - Prob. 28ECh. 15.4 - Prob. 29ECh. 15.4 - The paper Feedback Enhances the Positive Effects...Ch. 15.4 - The following graphs appear in the paper Which...Ch. 15.4 - The behavior of undergraduate students when...Ch. 15.4 - Prob. 33ECh. 15.4 - The following partially completed ANOVA table...Ch. 15.4 - Prob. 35ECh. 15.4 - The accompanying ANOVA table is similar to one...Ch. 15.4 - Identification of sex in human skeletons is an...Ch. 15 - Suppose that a random sample or size n = 5 was...Ch. 15 - Parents are frequently concerned when their child...Ch. 15 - Prob. 40CRCh. 15 - Consider the accompanying data on plant growth...Ch. 15 - Prob. 42CRCh. 15 - Prob. 43CRCh. 15 - Prob. 44CRCh. 15 - Prob. 45CRCh. 15 - Prob. 46CRCh. 15 - Prob. 47CRCh. 15 - Prob. 48CRCh. 15 - Prob. 49CR
Knowledge Booster
Background pattern image
Statistics
Learn more about
Need a deep-dive on the concept behind this application? Look no further. Learn more about this topic, statistics and related others by exploring similar questions and additional content below.
Recommended textbooks for you
Text book image
Functions and Change: A Modeling Approach to Coll...
Algebra
ISBN:9781337111348
Author:Bruce Crauder, Benny Evans, Alan Noell
Publisher:Cengage Learning
Text book image
Holt Mcdougal Larson Pre-algebra: Student Edition...
Algebra
ISBN:9780547587776
Author:HOLT MCDOUGAL
Publisher:HOLT MCDOUGAL
Text book image
Glencoe Algebra 1, Student Edition, 9780079039897...
Algebra
ISBN:9780079039897
Author:Carter
Publisher:McGraw Hill
Continuous Probability Distributions - Basic Introduction; Author: The Organic Chemistry Tutor;https://www.youtube.com/watch?v=QxqxdQ_g2uw;License: Standard YouTube License, CC-BY
Probability Density Function (p.d.f.) Finding k (Part 1) | ExamSolutions; Author: ExamSolutions;https://www.youtube.com/watch?v=RsuS2ehsTDM;License: Standard YouTube License, CC-BY
Find the value of k so that the Function is a Probability Density Function; Author: The Math Sorcerer;https://www.youtube.com/watch?v=QqoCZWrVnbA;License: Standard Youtube License