Videos
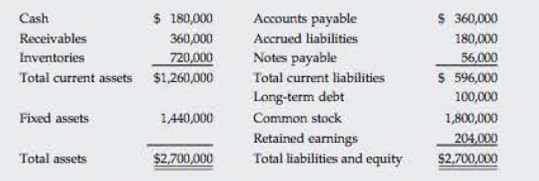
ADDITIONAL FUNDS NEEDED Morrissey Technologies Inc.’s 2016 financial statements are shown here.
Morrissey Technologies Inc.: Balance Sheet as of December 31, 2016
Morrissey Technologies Inc.: Income Statement for December 31, 2016
| Sales | $3,600,000 |
| Operating costs including depredation | 3,279,720 |
| EBIT | $ 320,280 |
| Interest | 20,280 |
| EBT | $ 300,000 |
| Taxes (40%) | 120,000 |
| Net Income | $ 180,000 |
| Per Share Data: | |
| Common stock price | $45.00 |
| Earnings per share (EPS) | $ 1.80 |
| Dividends per share (DPS) | $ 1.08 |
Suppose that in 2017, sales increase by 10% over 2016 sales. The firm currently has 100,000 shares outstanding. It expects to maintain its 2016 dividend payout ratio and believes that its assets should grow at the same rate as sales. The firm has no excess capacity. However, the firm would like to reduce its operating costs/sales ratio to 87.5% and increase its total liabilities-to-assets ratio to 30%. (It believes its liabilities-to-assets ratio currently is too low relative to the industry average.) The firm will raise 30% of the 2017 forecasted interest- bearing debt as notes payable, and it will issue long-term bonds for the remainder. The firm
- a. Construct the forecasted financial statements assuming that these changes are made. What are the firm’s forecasted notes payable and long-term debt balances? What is the forecasted addition to
retained earnings ? - b. If the profit margin remains at 5% and the dividend payout ratio remains at 60%, at what growth rate in sales will the additional financing requirements be exactly zero? In other words, what is the firm’s sustainable growth rate? (Hint: Set AFN equal to zero and solve for g.)
a.
To construct: The forecasted financial statements for the year 2017 and to calculate the firm’s forecasted notes payable and long-term debts balance and forecasted addition to retained earnings
Introduction:
Financial Statements:
Financial statements are the statements, which tell about the financial activities of the company. A financial statement of a company includes its income statement, balance sheet, and cash flows statement.
Income Statement:
Income statement is a business’s financial statement, which tells the financial performance of a company in an accounting period. It shows the income generated by a company and expenses incurred by a company through its operations.
Balance Sheet:
Balance sheet is the summarize statement of total assets and total liabilities of a company in an accounting period. It is one of the financial statements.
Additional Fund Needed:
Additional fund needed is also known as external financing needed. It is the state in which a company needed finance to increase its operation. Additional fund needed is a method in which a company raises the funds through external resources to increase its assets, which would increase the sales revenue of the firm.
But according to additional fund needed method, a company do not change its financial ratio. Liabilities and retained earnings spontaneously increase with the increase in sales and assets.
Explanation of Solution
| Company M | |
| Income Statement | |
| For the year ended December 31,2017 | |
| Particulars |
Amount ($) |
| Sales | 3,960,000 |
| Less:-Operating costs including depreciation | 3,465,000 |
| EBIT | 495,000 |
| Less:-Interest | 111,375 |
| EBT | 383,625 |
| Less:-Taxes | 153,450 |
| Net income | 230,175 |
| Per Share Data: | |
| Common stock price | 45 |
| Earnings per share (EPS) | 2.30 |
| Dividends per share (DPS) | 1.38 |
Table (1)
| Company M | ||
| Balance Sheet | ||
| For the year ended December 31, 2017 | ||
| Assets |
Amount ($) |
Amount ($) |
| Current assets: | ||
| Cash | 198,000 | |
| Accounts receivable | 396,000 | |
| Inventories | 792,000 | |
| Total current assets | 1,386,000 | |
| Fixed assets | 1,584,000 | |
| Total Assets | 2,970,000 | |
| Liabilities and Owners' Equity | ||
| Current Liabilities: | ||
| Notes payable | 728,000 | |
| Total current Liabilities | 728,000 | |
| Long-term debt | 163,000 | |
| Total Liabilities | 891,000 | |
| Owners' Equity: | ||
| Common stock | 1,782,930 | |
| Retained Earnings | 296,070 | |
| Total Stockholders' Equity | 2,079,000 | |
| Total Liabilities and Owners' Equity | 2,970,000 | |
Calculation of forecasted notes payable for 2017,
Given,
Notes payable for 2016 are $56,000.
Company will raise notes payable by 30%.
Formula to calculate the forecasted notes payable for 2017,
Substitute $560,000 for notes payable for 2016 and 30% for increment in notes payable.
Calculation of forecasted long term debts for 2017,
Given,
Liabilities (excluding retained earnings and common stock) for 2017 are $891,000 (working notes).
Notes payable for 2017 are $728,000.
Formula to calculate long term debts for 2017,
Substitute $891,000 for liabilities (excluding retained earnings and common stock) and $728,000 for notes payable.
Calculation of addition to retained earnings for the year 2017
Given,
Dividend paid for the year ended 2017 is $138,105.
Net income for the year ended is $230,175.
Formula to calculate addition to retained earnings,
Substitute $230,175 for net income and $138,105 for dividend paid.
Working notes:
Calculation of estimated sales for the year 2017
Given,
Sales for the year 2016 are $3,600,000.
Increment in sales is 10%.
Calculation of estimated sales for 2017,
Calculation of estimated operating costs including depreciation for the year 2017
Given,
The firm would like to reduce its operating cost/sales ratio to 87.5%.
Sales of the year 2017 are $3,960,000.
Calculation of operating costs including depreciation,
Calculation of estimated total assets for 2017,
Given,
Value of total assets for 2016 is $2,700,000.
The assets should grow at the same rate as sales, which is 10%.
Calculation of the total assets,
Calculation of estimated cash for 2017,
Given,
Value of cash for 2016 is $180,000.
The assets should grow at the same rate as sales, which is 10%.
Calculation of estimated cash for 2017,
Calculation of estimated receivable for 2017,
Given,
Value of receivable for 2016 is $360,000.
The assets should grow at the same rate as sales, which is 10%.
Calculation of estimated receivable for 2017,
Calculation of estimated inventories for 2017,
Given,
Value of inventories for 2016 is $720,000.
The assets should grow at the same rate as sales, which is 10%.
Calculation of estimated inventories for 2017,
Calculation of estimated fixed assets for 2017,
Given,
Fixed assets for 2016 are $1,440,000.
The assets should grow at the same rate as sales, which is 10%.
Calculation of estimated fixed assets for 2017,
Calculation of estimated total liabilities (excluding retained earnings and common stock) for 2017,
Given,
The liabilities-to-assets ratio for 2017 is 30%.
Estimated assets for 2017 are 2,970,000.
Calculation of estimated liabilities (excluding retained earnings and common stock) for 2017,
Calculation of estimated interest for 2017,
Given,
Forecasted notes payable for 2017 are $728,000.
Forecasted long terms debts are $891,000.
Interest rate is 12.5%.
Calculation of estimated interest,
Calculation of taxes
Given,
Tax rate is 40%
EBT for the year 2017 is $383,625.
Calculation of taxes,
Calculation of Earnings per share,
Given,
Estimated net income for 2017 is $230,175.
Shares outstanding are 100,000.
Calculation of EPS,
Calculation of dividend paid in 2016,
Given,
Dividend per share for 2016 is $1.08.
Shares outstanding for 2016 is 100,000
Formula to calculate Dividend paid in 2016,
Calculation of dividend payout ratio,
Given,
Dividend paid for the year 2016 is $108,000.
Net income for the year 2016 is $180,000.
Calculation of the dividend payout ratio,
Calculation of dividend paid during 2017
Given
Dividend payout ratio remains constant, which is 60%.
Net income for the year 2017 is $230,175.
Calculation of dividend paid during 2017,
Calculation of estimated dividend per share for 2017,
Given,
Dividend paid during 2017 is $138,105.
Shares outstanding are 100,000.
Calculation of dividend per share,
Calculation of estimated value of common stock for 2017,
Given,
Estimated total assets for 2017 are $2,970,000.
Estimated liabilities (excluding retained earnings and common stock) are $891,000
Estimated retained earnings for 2017 are $92,070.
Calculation of common stock for 2017,
The forecasted notes payable for 2017 are $728,000, the forecasted long term debts are $163,000 and the addition in retained earnings are 92,070.
b.
To find: Firm’s sustainable growth rate in sales.
Explanation of Solution
Calculation of sustainable growth rate,
Given,
The profit margin is 5%.
The dividend payout ratio is 60%.
Current sales for 2017 are $3,960,000.
Total assets for 2017 are $2,970,000.
Spontaneous current liability for 2017 is $891,000.
Formula to calculate sustainable growth rate in sales,
Substitute 5% (or 0.05) for profit margin, 6% (or 0.6) for payout ratio, $3,960,000 for current sales, $2,970,000 for total assets and $891,000 for spontaneous current liability.
The sustainable growth rate is 3.96%.
Want to see more full solutions like this?
Chapter 16 Solutions
Fundamentals of Financial Management, Concise Edition (MindTap Course List)


- Delta Designs, Inc. Comparative Balance Sheet December 31, 2018 and 2017 2018 2017 Assets Total Current Assets $32,250 $66,600 Property, Plant, and Equipment, Net 180,750 168,720 Other Assets 37,000 60,680 Total Assets $250,000 $296,000 Liabilities Total Current Liabilities $30,500 $45,880 Long-term Debt 80,750 204,536 Total Liabilities 111,250 250,416 Stockholders' Equity Total Stockholders' Equity 138,750 45,584 Total Liabilities and Stockholders' Equity $250,000 $296,000 Perform a vertical analysis of DeltaDelta Designs' balance sheet for each year. (Round the percent of total amounts to one decimal place, X.X%.) Delta Designs, Inc. Balance Sheet December 31, 2018 and 2017 2018 Percent of Total…arrow_forwardSeminole Corporation reported the following items at December 31, 2021, and 2020: (Click the icon to view the comparative financial information.) Read the requirements. Requirement 1. Compute the company's (a) quick (acid-test) ratio and (b) days' sales outstanding for 2021. Evaluate each ratio value as strong or weak. All sales are on account with terms of net 30 days. (a) Enter the formula and calculate the quick (acid-test) ratio for 2021. (Abbreviation used: Cash* = Cash and cash equivalents. Round your final answer to two decimal places.) Cash* + Short-term investments + Net current receivables + Total current liabilities = Quick (acid-test) ratio $ Seminole's quick (acid-test) ratio is considered fairly weak. (b) Select the formula and calculate Seminole's days' sales outstanding for 2021. (Round interim calculations to two decimal places, XX.XX. Round the days' sales outstanding up to the next whole day.) Accounts receivable turnover = + Days' sales outstanding Seminole's days'…arrow_forwardFinancial Information for Powell Panther Corporation is shown below: Powell Panther Corporation: Income Statements for Year Ending December 31 (millions of dollars) 2020 $2,500.0 2,125.0 $375.0 75.0 $300.0 55.0 $ 245.0 98.0 $147.0 $152.1 $117.6 Common dividends Powell Panther Corporation: Balance Sheets as of December 31 (millions of dollars) 2020 Sales Operating costs excluding depreciation and amortization EBITDA Depreciation and amortization Earnings before interest and taxes (EBIT) Interest Earnings before taxes (EBT) Taxes (25%) Net Income Assets Cash and equivalents Accounts receivable Inventories Total current assets Net plant and equipment Total assets 2021: $ b. What was the 2021 free cash flow? 2021 $2,875.0 2,444.0 $ 431.0 86.0 $345.0 63.3 $281.7 112.7 $ 169.0 $ -Select- 2021 46.0 450.0 540.0 $1,036.0 863.0 $1,899.0 Liabilities and Equity Accounts payable Accruals Notes payable Total current liabilities $601.5 Long-term bonds 575.0 Total liabilities $1,176.5 661.5 Common…arrow_forward
- The following table gives abbreviated balance sheets and income statements for Walmart. At the end of fiscal 2019, Walmart had 2,832 million shares outstanding with a share price of $94. The company's weighted-average cost of capital was about 5%. Assume a tax rate of 21%. Assets Current assets: Cash and marketable securities Accounts receivable Inventories Balance Sheet (figures in $ millions) Fiscal 2019 Other current assets Total current assets Fixed assets: Net fixed assets Other long-term assets Total assets ies and Shareholders' Equity Current liabilities: Accounts payable Other current liabilities Total current liabilities Long-term debt Other long-term liabilities Total liabilities Total shareholders' equity Total liabilities and shareholders' equity Net sales Cost of goods sold Selling, general, and administrative expenses Depreciation Other income/expenses Earnings before interest and taxes (EBIT) Interest expense Taxable income Tax Net income Income Statement (figures in $…arrow_forwardRefine Assumptions for Dividend and Retained Earnings Forecast Provided below is FY2016 information for Medtronic PLC. Medtronic plc Consolidated Statement of Income ($ millions) Apr. 29, 2016 Net sales $29,277 Costs and expenses Cost of products sold 9,142 Research and development expenses 2,224 Selling, general, and administrative expense 9,469 Special charges (gains), net 70 Restructuring charge, net 290 Certain litigation charges, net 26 Acquisition-related items 283 Amortization of intangiable assets 1,931 Other expense, net 107 Operating profit 5,735 Interest expense, net 955 Income from operations before income taxes 4,780 Provision for income taxes 908 Net income $3,872 Medtronic plc Consolidated Balance Sheet ($ millions) Apr. 29, 2016 Apr. 24, 2015 Current assets Cash and cash equivalents $2,975 $4,942 Investments 9,758 14,637 Accounts receivable 5,562 5,112 Inventories 3,473 3,463 Tax assets 697 1,335 Prepaid expenses and other current assets…arrow_forwardEstimating Market and Book Values and Cost of Capital MeasuresThe December 31, 2018, partial balance sheet of 3M Company follows (amounts in millions, except share and per share amounts). YCharts.com reported that the total market capitalization of 3M was $108.46 billion and its stock price was $190.54 as of December 31, 2018. Also, YCharts.com estimates its total enterprise value at $119.84 billion, and its market beta at 1.14. 3M’s average pretax borrowing cost is 2.07%, and its assumed statutory tax rate is 21%. Assume that the risk-free rate equals 2.1% and the market premium equals 5%. Liabilities Current liabilities Short-term borrowings and current portion of long-term debt $1,211 Accounts payable 2,266 Accrued payroll 749 Accrued income taxes 243 Other current liabilities 2,775 Total current liabilities 7,244 Long-term debt 13,411 Pension and post-retirement benefits 2,987 Other liabilities 3,010 Total liabilities 26,652 Equity 3M Company…arrow_forward
- Estimating Market and Book Values and Cost of Capital MeasuresThe December 31, 2018, partial balance sheet of 3M Company follows (amounts in millions, except share and per share amounts). YCharts.com reported that the total market capitalization of 3M was $108.46 billion and its stock price was $190.54 as of December 31, 2018. Also, YCharts.com estimates its total enterprise value at $119.84 billion, and its market beta at 1.14. 3M’s average pretax borrowing cost is 2.07%, and its assumed statutory tax rate is 21%. Assume that the risk-free rate equals 2.1% and the market premium equals 5%. Liabilities Current liabilities Short-term borrowings and current portion of long-term debt $1,211 Accounts payable 2,266 Accrued payroll 749 Accrued income taxes 243 Other current liabilities 2,775 Total current liabilities 7,244 Long-term debt 13,411 Pension and post-retirement benefits 2,987 Other liabilities 3,010 Total…arrow_forwardIncome statement. Construct the Barron Pizza, Inc. income statement for the year ending 2015 with the following information (the dollar amounts are in thousands of dollars) Shares outstanding: 16,673,000 Tax rate: 37.5% Interest expense: $6,072 Revenue: $889,345 Depreciation: $31,256 Selling, general, and administrative expense: S77,498 Other income: $1,118 Research and development. $4,193 Cost of goods sold: $750,757 Note: Enter all expenses as negative numbers. (Round the earnings per share to the nearest cent. Also, use a minus sign for numbers to be subtracted.) Income Statement Barron Pizza, Incorporated Year Ending 2015 (S in thousands, except earnings per share) Gross profit %24 %24 %24arrow_forwardSome selected financial statement items belonging to Tower Company are given in the table below. According to this information, which of the following is Return on Assets (ROA) in 2021? Inventory 12,500 Total Assets in 2021 100,000 Current Liabilities 30,000 Total Assets in 2020 80,000 Net Profit 18,000 Shareholders' Equity 65,000 Select one: a. 24% b. 20% c. 11% d. 15%arrow_forward
- The following table gives abbreviated balance sheets and income statements for Walmart. At the end of fiscal 2017, Walmart had 3,060 million shares outstanding with a share price of $146. The company's weighted-average cost of capital was about 5%. Assume a tax rate of 35%. Balance Sheet (figures in $ millions) End of Year Start of Year Assets Current assets: Cash and marketable securities $ 6,956 $ 7,067 Accounts receivable 5,814 6,035 Inventories 43,983 43,246 Other current assets 3,711 2,141 Total current assets $ 60,464 $ 58,489 Fixed assets: Net fixed assets $ 115,018 $ 114,378 Other long-term assets 30,240 27,158 Total assets $ 205,722 $ 200,025 Liabilities and Shareholders' Equity Current liabilities: Accounts payable $ 46,292 $ 41,633 Other current liabilities 32,629 25,695 Total current liabilities $ 78,921 $ 67,328 Long-term debt 37,025…arrow_forwardFINANCIAL STATEMENT ANALYSIS DATA INFORMATION Statement of Financial Position of cf company 2015 2016 Cash and Cash Equivalents $ 990,000.00 $ 950,000.00 Short Term Marketable Securities $ 10,000.00 $ 15,000.00 Accounts Receivable $ 1,020,000.00 $ 1,550,000.00 Inventory $ 1,005,000.00 $ 1,360,000.00 Other Current Assets $ 870,000.00 $ 1,150,000.00 Total Current Assets $ 3,895,000.00 $ 5,025,000.00 Fixed Assets $ 14,006,000.00 $ 17,605,000.00 Accumulated Depreciation $ -1,280,000.00 $ -1,700,000.00 Net Fixed Assets $ 12,726,000.00 $ 15,905,000.00 Longterm Investments $ 360,000.00 $ 320,000.00 Investments in Other Companies $ 65,000.00 $ - Intangibles and Other Assets $ 100,000.00 $ 110,000.00 Total Non Current Assets $…arrow_forwarddrake CORPORATION drake CORPORATION Statement of Financial Position Statement of Comprehensive Income 2015 2016 2015 2016 Net Sales 12,060,000 16,700,000 Cash and Cash Equivalents $ 990,000.00 $ 950,000.00 Other Operating Revenues 16,000 19,000 Short Term Marketable Securities $ 10,000.00 $ 15,000.00 Total Revenues 12,076,000 16,719,000 Accounts Receivable $ 1,020,000.00 $ 1,550,000.00 Cost of Goods Sold (4,950,000) (7,050,000) Inventory $ 1,005,000.00 $ 1,360,000.00 Other Operating Expenses (11,000) (13,000) Other Current Assets $ 870,000.00 $ 1,150,000.00 Total Direct Expenses (4,961,000) (7,063,000) Total Current Assets $ 3,895,000.00 $ 5,025,000.00 Selling, General & Administrative (3,300,000) (3,880,000) Operating Income 3,815,000 5,776,000 Fixed Assets $ 14,006,000.00 $ 17,605,000.00…arrow_forward
 Fundamentals Of Financial Management, Concise Edi...FinanceISBN:9781337902571Author:Eugene F. Brigham, Joel F. HoustonPublisher:Cengage Learning