
Videos
Comparative ratio analysis
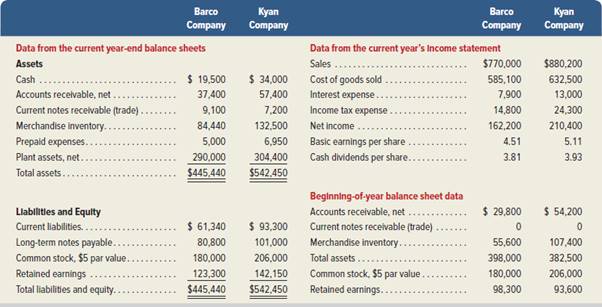
Summary information from the financial statements of two companies competing in the same industry follows.
Required
- 1. For both companies compute the (a)
current ratio , (b) acid-test ratio, (c) accounts (including notes) receivable turnover, (d) inventory turnover, (e) days’ sales in inventory, and (f) days’ sales uncollected. Identify the company you consider to be the better short-term credit risk and explain why. Round to one decimal place.
Check (1) Kyan: Accounts receivable turnover, 14.8; Inventory turnover, 5.3
- 2. For both companies compute the (a) profit margin ratio, (b) total asset turnover, (c) return on total assets, and (d) return on common stockholders’ equity. Assuming that each company’s stock can be purchased at $75 per share, compute their (e) price-earnings ratios and ( f) dividend yields. Round to one decimal place. Identify which company’s stock you would recommend as the better investment and explain why.
(2) Barco: Profit margin, 21.1%; PE, 16.6
1.
Compute the (a) current ratio, (b) acid-test ratio, (c) accounts (including notes) receivable turnover, (d) inventory turnover, (e) days’ sales in inventory, and (f) days’ sales uncollected of Company F and Company B and identify the company that would the better on terms of short-term credit risk and explain the reasons.
Explanation of Solution
- a) Current ratio: Current ratio is one of the liquidity ratios, which measures the capacity of the company to meet its short-term obligations using its current assets. Current ratio is calculated by using the formula:
- b) Acid-test ratio: It is a ratio used to determine a company’s ability to pay back its current liabilities by liquid assets that are current assets except inventory and prepaid expenses.
- c) Accounts receivables turnover ratio: Receivables turnover ratio is mainly used to evaluate the collection process efficiency. It helps the company to know the number of times the accounts receivable is collected in a particular time period. This ratio is determined by dividing credit sales and average net receivables.
- d) Inventory Turnover Ratio: This ratio is a financial metric used by a company to quantify the number of times inventory is used or sold during the accounting period. It is calculated by using the formula:
- e) Days’ sales in inventory: Days’ in inventory is determined as the number of days a particular company takes to make sales of the inventory available with them.
- f) Days’ sales uncollected: This ratio is used to determine the number of days a particular company takes to collect accounts receivables.
Compute ratios of Company B and Company K:
| Ratios | Company B | Company K | |
| (a) Current ratio | |||
| Cash | $19,500 | $34,000 | |
| Accounts receivables, net | $37,400 | $57,400 | |
| Current notes receivable (trade) | $9,100 | $7,200 | |
| Merchandise inventory | $84,440 | $132,500 | |
| Prepaid expenses | $5,000 | $6,950 | |
| Current assets (A) | $155,440 | $238,050 | |
| Current liabilities (B) | $61,340 | $93,300 | |
| Current ratio | 2.5:1 | 2.6:1 | |
| (b) Acid-test ratio | |||
| Cash | $19,500 | $34,000 | |
| Accounts receivables, net | $37,400 | $57,400 | |
| Current notes receivable (trade) | $9,100 | $7,200 | |
| Quick assets (C) | $66,000 | $98,600 | |
| Current liabilities (D) | $61,340 | $93,300 | |
| Acid-test ratio | 1.1:1 | 1.1:1 | |
| (c) Accounts (including notes) receivables turnover ratio | |||
| Accounts receivables, net (E) | $29,800 | $54,200 | |
| Current notes receivable (trade) (F) | $0 | $0 | |
| Total beginning net accounts (including notes) receivables (G) | $29,800 | $54,200 | |
| Accounts receivables, net (H) | $37,400 | $57,400 | |
| Current notes receivable (trade) (I) | $9,100 | $7,200 | |
| Total ending net accounts (including notes) receivables (J) | $46,500 | $64,600 | |
| Average net accounts (including notes) receivables (K) | $38,150 | $59,400 | |
| Net credit sales (L) | $770,000 | $880,200 | |
| Accounts (including notes) receivables turnover ratio | 20.2 times | 14.8 times | |
| (d) Inventory turnover ratio | |||
| Ending inventory (M) | $84,440 | $132,500 | |
| Beginning inventory (N) | $55,600 | $107,400 | |
| Average inventory (O) | $70,020 | $119,950 | |
| Cost of goods sold (P) | $585,100 | $632,500 | |
| Inventory turnover ratio | 8.4 times | 5.3 times | |
| (e) Days’ sales in inventory | |||
| Ending inventory (Q) | $84,440 | $132,500 | |
| Cost of goods sold (R) | $585,100 | $632,500 | |
| Days’ sales in inventory | 52.7 days | 76.5 days | |
| (f) Days’ sales uncollected | |||
| Ending Accounts receivables, net (S) | $37,400 | $57,400 | |
| Ending Current notes receivable (trade) (T) | $9,100 | $7,200 | |
| Total ending net accounts (including notes) receivables (U) | $46,500 | $64,600 | |
| Net credit sales (V) | $770,000 | $880,200 | |
| Days’ sales uncollected | 22.0 days | 26.8 days | |
Table (1)
Short term credit risk analysis: As per Table (1) the current ratio of Company K is slightly better than the current ratio of Company B. The acid-test ratios of both the companies are same. The accounts turnover and the inventory turnover of Company B are better than the ratios of Company F. However, the day’s sales in inventory and the day’s sales uncollected of Company F are 76.5 days and 26.8 days respectively, that are higher than the ratios of Company B. Hence, Company B is better in managing the short term credit risk.
2.
Compute the (a) profit margin ratio, (b) total asset turnover, (c) return on total assets, (d) return on common stockholders’ equity, (e) price earnings ratio, and (f) dividend yields of Company F and Company B and identify the company that could be recommended as better investment and explain the reasons.
Explanation of Solution
- a) Profit margin: It is one of the profitability ratios. Profit margin ratio is used to measure the percentage of net income that is being generated per dollar of revenue or sales.
- b) Total asset turnover: Total asset turnover is a ratio that measures the productive capacity of the total assets to generate the sales revenue for the company. Thus, it shows the relationship between the net sales and the average total assets. Turnover of assets is calculated as follows:
- c) Return on total assets: Return on total assets is the financial ratio that determines the amount of net income earned by the business with the use of total assets owned by it. It indicates the magnitude of the company’s earnings with relative to its total assets. Return on investment is calculated as follows:
- d) Return on common stockholders’ equity ratio: It is a profitability ratio that measures the profit generating ability of the company from the invested money of the shareholders. The formula to calculate the return on equity is as follows:
- e) Price/Earnings Ratio: The price/earnings ratio shows the market value of the amount invested to earn $1 by a company. It is major tool used by investors for making decisions related to the investment in a company.
- f) Dividend yields: Dividend yield ratio indicates how much percentage of share prices a company pays out in the form of dividends price. The formula to calculate the dividend yield percentage is as follows:
Compute ratios of Company B and Company K:
| Ratios and Formula | Company B | Company K |
|
a. Profit margin: | ||
|
b. Total asset turnover: | ||
|
c. Return on total assets: | ||
|
d. Return on common stockholders’ equity: | ||
|
e. Price-earnings ratio: | ||
|
f. Dividend yield: |
Table (2)
Investment analysis: As per Table (2) the profitability ratios of Company K is higher than the ratios of Company B. However, the price earnings ratio of Company B is higher than Company K, but the dividend yield of Company K is higher than Company B. Hence, Company K is a better investment option.
Working Note:
Determine the average total assets and average common stockholders’ equity.
| Ratios and Formula | Company B | Company K |
|
a. Average total assets: | ||
|
b. Average common stockholders’ equity: |
Table (3)
Want to see more full solutions like this?
Chapter 17 Solutions
Principles of Financial Accounting.


- Which of the following is included in the numerator of the Acid-Test Ratio calculation (check all that apply) A. Supplies B. Net Current Receivables C. Short-Term Investments D. Merchandise Inventory Which of the following ratios helps measure a company's ability to pay its current liabilities? (check all that apply) A. Accounts Receivable Turnover B. Days' Sales in Inventory C. Acid Test Ratio D. Cash Ratioarrow_forwardAssess the company’s level of liquidity and comment on its ability to meet its short-termfinancial obligations using the following ratios :a. Current Ratiob. Acid-Test or Quick Ratioc. Average collection periodd. Accounts Receivable Turnover ratioe. Inventory Turnover Ratioarrow_forwardVII. Direction: Compute and interpret. The following comparative financial statements are provided by Avatar Industries. You were asked to compute the different financial ratios and provide your interpretations with regards to profitability, efficiency, liquidity and solvency of the company. Use the Answer Sheet template below to input your answer and solution. AVATAR INDUSTRIES AVATAR INDUSTRIES Comparative Statement of Financial Position For the years 2019 and 2018 Comparative Income Statement For the years 2019 and 2018 2019 2018 2019 2018 ASSETS Current Assets: Sales P200,000 P210,000 Cash & Cash Equivalent P65,000 P70,000 Sales Returns and Allowances 40,000 25,000 Accounts Receivable 40,000 35,000 Net Sales 160,000 185,000 Marketable Secuities 40,000 35,000 Cost of Goods Sold 100,000 115,625 Inventory 100,000 80,000 Gross Profit 60,000 69,375 Total Current Assets 220,000 200,000 160,000 P445,000 P380,000 245,000 Operating Expenses: Fixed Assets Selling Expenses 22,000 25,000 Total…arrow_forward
- VII. Direction: Compute and interpret. The following comparative financial statements are provided by Avatar Industries. You were asked to compute the different financial ratios and provide your interpretations with regards to profitability, efficiency, liquidity and solvency of the company. Use the Answer Sheet template below to input your answer and solution. AVATAR INDUSTRIES AVATAR INDUSTRIES Comparative Statement of Financial Position For the years 2019 and 2018 Comparative Income Statement For the years 2019 and 2018 2019 2018 2019 2018 ASSETS Current Assets: Sales P200,000 P210,000 Cash & Cash Equivalent P65,000 P70,000 Sales Returns and Allowances 40,000 25,000 Accounts Receivable 40,000 35,000 Net Sales 160,000 185,000 Marketable Securities 40,000 35,000 Cost of Goods Sold 100,000 115,625 Inventory 100,000 80,000 Gross Profit 60,000 69,375 Total Current Assets 245,000 220,000 Operating Expenses: Fixed Assets 200,000 160,000 Selling Expenses 22,000 25,000 Total Assets P445,000…arrow_forward(A)Prepare ratio analyses (for 2019, 2018, and 2017) for both companies.You should include the following ratios in your computations: 1. Profitability ratios Gross Profit margin Profit margin Return on assets Return on equity 2. Productivity Inventory Turnover Accounts Receivable Turnover PPE Turnover Asset Turnover 3. Solvency Debt-to-equity Times interest earned Return on Financial leverage 4. Liquidity Current Ratio Quick Ratio Operating cash flow to current liabilities Working capitalarrow_forwardBased on the Balance sheet calculate: 1.Current Ratio 2. Acid Test or Quick Ratio 3. Cash Ratio 4. Debt Ratio 5. Debt to Equity Ratio 6. Asset Turnover Ratio 7. Receivable Turnover Ratio and 8. Day Sales to Inventory Ratio. Based on the calculations presented above interpret the overall performance of BMW AG Group’s and the line items it must stay focused upon. Discuss its overall financial status having calculated the ratios across the years, considering the impact of Covid-19 while support decision-making related to its future growth and profitabilityarrow_forward
- Question 1 Mabel is a potter and sells her pottery at stalls that she rents in four tourist information centres across the south of England. Extracts from her financial statements for the years ended 31 December 2021 and 2020 are shown below. Statement of profit or loss for the year ended 31 December: 2021 28,900 |(16,500) 12,400 (3,800) 8,600 |(4,000) 4,600 2020 Revenue 27,200 (14,000) 13,200 (3,600) 9,600 Cost of sales Gross profit Operating expenses Operating profit Non-operating expenses Net profit 9,600 Statement of financial position as at 31 December: 2021 Non-current assets Current assets Total assets 22,660 4,360 27,020 2020 20,920 3,750 24,670 Equity Non-current liabilities Current liabilities Equity and liabilities 20,940 3,000 3,080 27,020 16,340 3,500 4,830 24,670 The following information is also relevant: In July 2021 the rent on one of Mabel's stalls was increased significantly for the third time in three years so she decided not to renew the annual contract. She sold…arrow_forwardSargassum Caribbean Incorporated Balance Sheet as at December 31, 2020 Assets Liabilities Current Assets: Current Liabilities: Cash Accounts Payable 600,000 300,000 200,000 400,000 Notes Payable 900,000 1,500,000 Total Current Liabilities Accounts Receivable Inventory Total Current Assets 900,000 Fixed Assets: Long-Term Liabilities: Property, Plant & Equipment Less: Accumulated Depreciation 1,200,000 Long-Term Debt 1,000,000 Total Long Term Liabilities 200,000 300,000 300,000 Net Fixed Assets Owners' Equity: Common Stock ($1 Par) Capital Surplus Retained Earnings Total Owners' Equity 100,000 300,000 100,000 500,000 Total Assets 1,700,000 Total Liabilities & Owners' Equity 1,700,000 Sargassum Caribbean Incorporated Income Statement for Year Ending December 31, 2020 Sales 2,500,000 800,000 100,000 104,000 1,496,000 Less: Cost of Goods Sold Less: Administrative Expenses Less Depreciation Earnings Before Interest and Тахes Less: Interest Expense 20.000 1,476,000 663,000 813,000 417,000…arrow_forwardResolve and explain the result of the current ratio for XYZ Company and compare andexplain this result with the Industry average, where current liabilities = $581,000 andcurrent assets = $832,000. a. Resolve the current ratio for XYZ Company b.Explain the result of the current ratio for XYZ Company c.Compare and explain the result of the current ratio for XYZ Company with the Industryaverage.arrow_forward
- a) Calculate the following ratios i)Gross profit ii)Net profit before taxi iii)Current ratio iv)Accounts receivable turnover in days v)Inventory turnover in days vi)Accounts payable turnover vii)Times interest covered viii)Debt/equity. b)Comment on the profitability and stability of the company using the ratios calculated in (a)(plus any others you think may be relevant) and make recommendations to your friend.arrow_forwardBelow are the two basic financial statements of Chiz Trading Company. You are tasked to prepare an analysis using Horizontal and Vertical Analysis of their two-dated financial statements. In addition to this you have been tasked to prepare financial ratios measuring the company’s: Liquidity Status Current Ratios Quick Asset Ratios Efficiency Status Asset Turnover Fixed Asset Turnover Inventory Turnover Days in Inventory Accounts Receivable Turnover Days in Receivable Profitability Status: Gross Profit margin Ratio Operating Income Ratio Net Profit Ratio Return on Assets Return on Equityarrow_forwardREQUIRED:: Calculate the following Ratios: a) Gross Profit Margin b) Net Profit Margin c) Current Ratio d) Quick Acid Ratio e) Inventory Turnover Ratio (Days) f) Accounts Receivable Turnover Ratio g) Accounts Payable Turnover Ratio h) Debt ratio i) Return on Assets b) Explain the limitation of ratio in a businessarrow_forward
 EBK CONTEMPORARY FINANCIAL MANAGEMENTFinanceISBN:9781337514835Author:MOYERPublisher:CENGAGE LEARNING - CONSIGNMENT