
Concept explainers
a)
To determine: System utilization rate.
Introduction: Poisson distribution is utilized to ascertain the probability of an occasion happening over a specific time period or interval. The interval can be one of time, zone, volume or separation. The probability of an event happening is discovered utilizing the equation in the Poisson distribution.
a)
Answer to Problem 17P
Explanation of Solution
Given Information:
It is given that the processing time is 4 customers per hour and there are 5 servers to process the customers.
| Class | Arrivals per Hour |
| 1 | 2 |
| 2 | 4 |
| 3 | 3 |
| 4 | 2 |
Calculate the system utilization:
It is calculated by adding all the total customer hours for each class and the result is divided with number of servers and customer process per hour.
Here,
M = number of servers
Hence the system utilization is 0.5500.
b)
To determine: The average customer waiting for service for each class and waiting in each class on average.
b)
Answer to Problem 17P
Explanation of Solution
Given Information:
| Class | Arrivals per Hour |
| 1 | 2 |
| 2 | 4 |
| 3 | 3 |
| 4 | 2 |
It is given that the processing time is 4 customers per hour and there are 5 servers to process the customers.
Calculate the average number of customers
It is calculated by dividing the total customers arrive per hour with customer process per hour.
Here,
r = average number of customers
Calculate average number of customers waiting for service (Lq) using infinite-source table values for
The Lq values for
Calculate A using Formula 18-16 from book:
It is calculated by subtracting 1 minus system utilization rate and multiplying the result with Lq, the whole result is divided by total customer arrival rate.
Here,
Lq = average number of customers waiting for service
Calculate B using Formula 18-17 from book for each category:
It is calculated by multiplying number of servers with customer service process rate per hour and the result is divided by total customer arrival rate for each category.
Here,
M = number of servers
Calculate the average waiting time for class 1 and class 2
It is calculated by multiplying A with B0 and B1, the result is divided by 1.
Calculate the average number of customers that are waiting for service for class 1 and class 2
It is calculated by multiplying total customer arrival rate with average waiting time for units in each category.
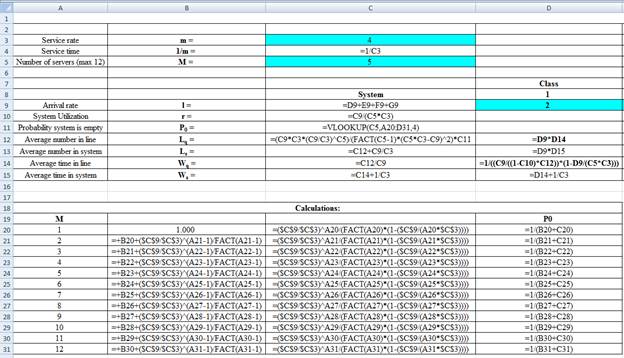
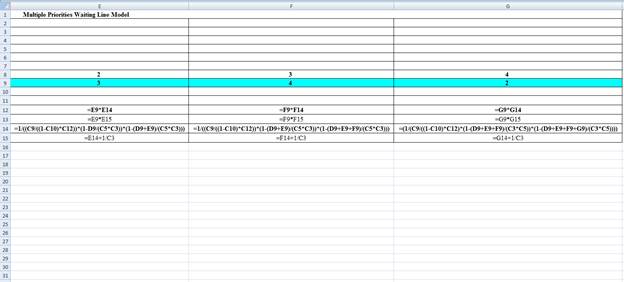
Excel Spreadsheet:
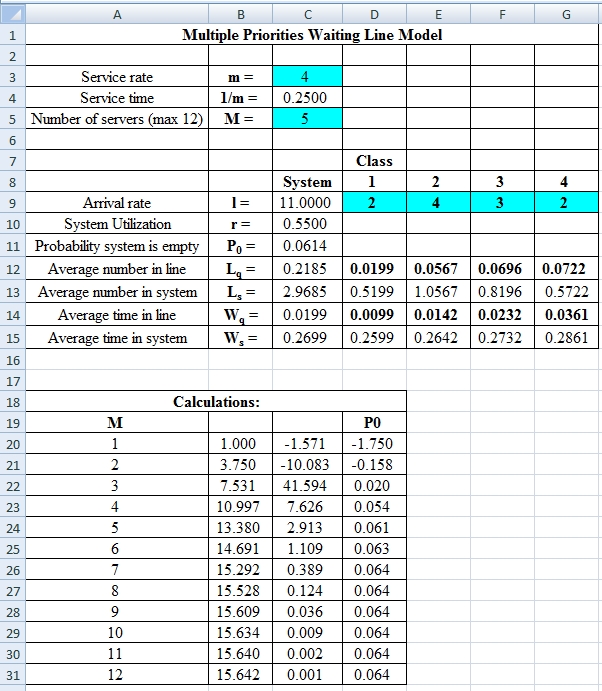
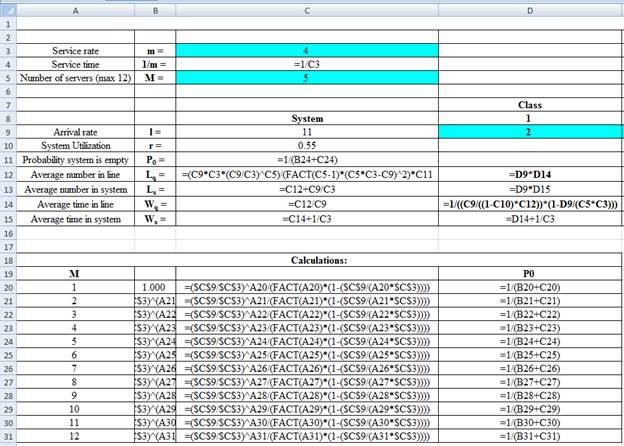
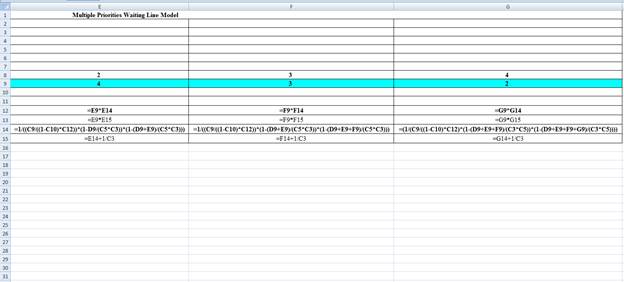
Excel Workings:
Hence the average wait time for service by customers for class 1 is 0.0099 hours, class 2 is 0.0142 hours, class 3 is 0.0232 hours and class 4 is 0.0361 hours. The waiting in each class on average for class 1 is 0.0199 customers, class 2 is 0.0567 customers, class 3 is 0.0696 customers and class 4 is 0.0722 customers.
c)
To determine: The average customer waiting for service for each class and waiting in each class on average.
c)
Answer to Problem 17P
Explanation of Solution
Given Information:
It is given that the processing time is 4 customers per hour and there are 5 servers to process the customers. The second priority class is reduced to 3 units per hour by shifting some into the third party class. The arrival rate is as follows,
| Class | Arrivals per Hour |
| 1 | 2 |
| 2 | 3 |
| 3 | 4 |
| 4 | 2 |
Calculate the average number of customers
It is calculated by dividing the total customers arrive per hour with customer process per hour.
Here,
r = average number of customers
Calculate average number of customers waiting for service (Lq) using infinite-source table values for
The Lq values for
Calculate A using Formula 18-16 from book
It is calculated by subtracting 1 minus system utilization rate and multiplying the result with Lq, the whole result is divided by total customer arrival rate.
Here,
Lq = average number of customers waiting for service
Calculate B using Formula 18-17 from book for each category
It is calculated by multiplying number of servers with customer service process rate per hour and the result is divided by total customer arrival rate for each category.
Here,
M = number of servers
Calculate the average waiting time for class 1 and class 2
It is calculated by multiplying A with B0 and B1, the result is divided by 1.
Calculate the average number of customers that are waiting for service for class 1 and class 2
It is calculated by multiplying total customer arrival rate with average waiting time for units in each category.
Excel Spreadsheet:
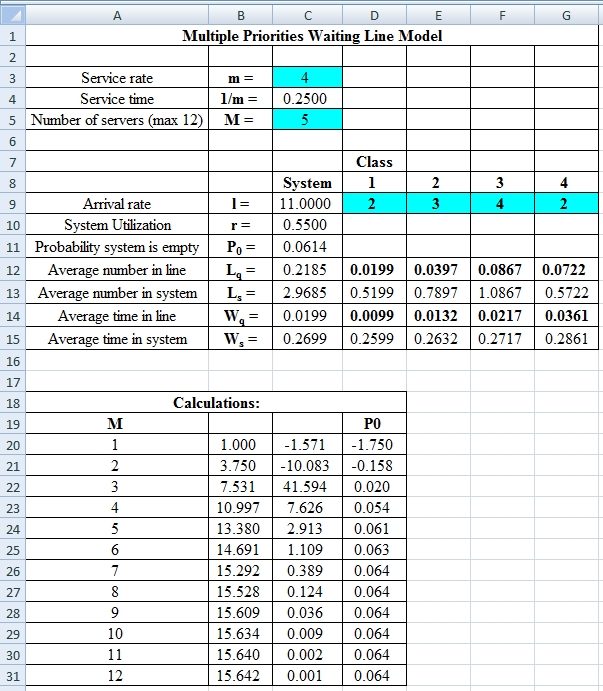
Excel Workings:
Hence the average wait time for service by customers for class 1 is 0.0099 hours, class 2 is 0.0132 hours, class 3 is 0.0217 hours and class 4 is 0.0361 hours. The waiting in each class on average for class 1 is 0.0199 customers, class 2 is 0.0397 customers, class 3 is 0.0867 customers and class 4 is 0.0722 customers.
d)
To determine: The observations based on the results from part c.
d)
Answer to Problem 17P
Explanation of Solution
Calculate the change in average wait time for each class.
It is calculated by subtracting the final answer for average wait time for service by customers from part b with the final answer for average wait time for service by customers from part c.
The above results suggest that there is a decrease in average wait time for class 2 and class 3. Class 1 and 4 remains constant.
Calculate the change in average number waiting for each class.
It is calculated by subtracting the final answer for waiting on average from part b with the final answer for waiting on average from part c.
The above results suggest that there is a decrease in average waiting for class 2 and an increase in class 3. Class 1 and 4 remains constant.
Want to see more full solutions like this?
Chapter 18 Solutions
Operations Management


- Fantastic styling salon is run by three stylists, each capable of serving five customers per hour, on average. If all customers wait in a common line for the next available stylist, how long would a customer wait in line, on average before being servedarrow_forwardDescribe a situation in your daily life that could be improved by waiting line analysis. Explain how the design of a waiting system can negatively affect customers. Visit your local bank and observe the waiting line system. Describe the system in terms of number of lines, number of facilities, and number of phases.arrow_forwardAnswer the given question with a proper explanation and step-by-step solution. Use the information. A cafeteria serving line has a coffee urn from which customers serve themselves. Arrivals at the urn follow a Poison distribution at the rate of 2.5 per minute. In serving themselves, customers take about 22 seconds, exponentially distributed.Use formulas to solve, no excel. Show all work. a. How many customers would you expect to see, on average, at the coffee urn? b.How long would you expect it to take to get a cup of coffee? c.What percentage of time is the urn being used? d. What is the probability that three or more people are in the cafeteria?arrow_forward
- Benny the Barber (see Question 1) is considering the addition of a second chair. Customers would be selected for a haircut on a FCFS basis from those waiting. Benny has assumed that both barbers would take an average of 20 minutes to give a haircut, and that business would remain unchanged with customers arriving at a rate of two per hour. Find the following information to help Benny decide if a second chair should be added: Part (a): The average number of customers waiting. Part (b): The average time a customer waits. Part (c): The average time a customer is in the shop.arrow_forwardOne field representative services 5 customers for a computer manufacturer. Customers request assistance at an average (Poisson-distributed) rate of once every 3.1 working days. The field representative can handle an average (Poisson-distributed) of 1.0 call per day. Determine: Use Table 1. a. The expected number of customers waiting. (Round "X" value to 2 decimal places. Round your answer to 3 decimal places.) Expected number of customers waiting b. The average length of time customers must wait from the initial request for service until the service has been completed. (Round your answer to 2 decimal places.) Average length of time days c. The percentage of time the service rep will be idle. (Round your answer to 1 decimal place.) Percentage of Idle time d. By how much would your answer to part a be reduced if a second field rep were added? (Round your answer to 3 decimal places.) Reduced number of customer(s)arrow_forwardThe prudential bank manager wants to improve its quality of service by reducing customer waiting times. To that end, a team of experts is needed to design what could be the best queuing strategy in order to have the minimum waiting time. Assuming your part of the team, what's the best queuing strategy to reduce the client's waiting time?arrow_forward
- Problem 15-9 (Algorithmic) Marty's Barber Shop has one barber. Customers have an arrival rate of 2.1 customers per hour, and haircuts are given with a service rate of 5 per hour. Use the Poisson arrivals and exponential service times model to answer the following questions: d. round your answer to four decimal places. What is the c. What is the P3- a haircor and no one is waiting if req d. What is the probability that one customer is receiving a haircut and two customers are waiting? If required, round your answer to four decimal places. Wq- customer is waiting? If rec e. What is the probability that more than two customers are waiting? If required, round your answer to four decimal places. P(More than 2 waiting) - f. What is the average time a customer waits for service? If required, round your answer to four decimal places. hours mal places.arrow_forwardIn an M/M/1 queueing system, the arrival rate is 5 customers per hour and the service rate is 7 customers per hour. What is the utilization? Note: Round your answer to 3 decimal places. What is the expected number of customers in the system (L)? Note: Round your answer to 3 decimal places. What is the expected waiting time in the system (W)? Note: Express the waiting time in hours, round your answer to 3 decimal places. What is the expected number of customers in the queue(Lq)? Note: Round your answer to 3 decimal places. What is the expected waiting time in the queue(Wq)?arrow_forwardThe BPD has three tellers to provide service. Each teller, on average, serves one customer in three minutes per customer, the latter arriving 50 every hour. Due to complaints received, an evaluation of the system has been requested:(a) Give the average utilization of the service system with the three tellers.b) What is the probability of arriving at the bank with no one there?c) What is the average number of customers waiting in line?d) On average how long does a customer wait in line to be served?e) On average how many customers would be served at a teller and waiting in line?arrow_forward
 Practical Management ScienceOperations ManagementISBN:9781337406659Author:WINSTON, Wayne L.Publisher:Cengage,