
Videos
Case Problem 3 Queen City
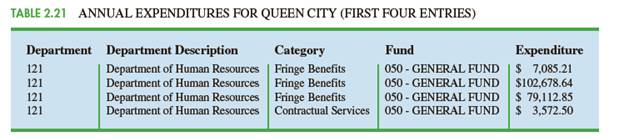
Cincinnati, Ohio, also known as the Queen City, has a population of approximately 298,000 and is the third largest city in the state of Ohio. The Cincinnati metropolitan area has a population of about 2.2 million. The city is governed by a mayor and a nine-member city council. The city manager, who is responsible for the day-to-day operation of the city, reports to the mayor and city council. The city manager recently created the Office of Performance and Data Analytics with the goal of improving the efficiency of city operations. One of the first tasks of this new office is to review the previous year's expenditures. The file QueenCity contains data on the previous year's expenditures, including the following:
Department The number of the department incurring the expenditure
Department Description The name of the department incurring the description
Category The category of the expenditure
Fund The fund to which the expenditure was charged
Expenditure The dollar amount of the expense
DATA file QueenCity Table 2.21 shows the first four entries of the 5427 expenditures for the year. The city manager would like to use this data to better understand how the city's budget is being spent.
Managerial Report
Use tabular and graphical methods of
2. A table that shows the amount of by department and the percentage of total expenditures by department. Combine any department with less than 1% into a category named "Other."

Trending nowThis is a popular solution!

Chapter 2 Solutions
Essentials of Modern Business Statistics with Microsoft Office Excel (Book Only)


- Darden Restaurants, Inc. (DRI) is the largest full-service restaurant company in the world. It operates over 2,200 restaurants under a variety of brand names, including Olive Garden, Bahama Breeze, and LongHorn Steakhouse. Panera Bread Company (PNRA) operates over 1,800 bakery-café locations across North America. It is one of the largest food service companies in the United States. The cost of food, beverage, and packaging and the beginning and ending inventory balances from recent annual reports for Darden and Panera are as follows (in millions): Darden Panera Cost of goods sold (food, beverage, and packaging) $2,039.7 $715.5 Inventories: Beginning of year 163.9 22.8 End of year 175.4 22.5 a. Compute the inventory turnover for both companies. Round all calculations to one decimal place. Inventory Turnover Darden Restaurants fill in the blank 1 Panera Bread fill in the blank 2 b. Compute the number of days’ sales in…arrow_forwardConsider the town of Acaford with a population of 5,000 people. There are 1,000 high school students, 1,000 undergraduate students, 1,000 graduate students, 1,000 economics professors, and 1,000 retired economists. Suppose that the total annual income in the economy is $100 million: Each high school student earns $6,000 annually; each undergraduate earns $10,000 annually; each graduate student earns $25,000 annually; each professor earns $55,000 annually; and each retiree earns $4,000 annually. The following chart shows the income distribution for the town of Acaford. 60 50 40 30 20 10 High SchoolUndergrads Grads Profs Retirees Suppose that the government sets the poverty line at an annual income of $18,000. The percentage of people with annual incomes below the poverty line in Acaford is 20%, 40%, 60% 80% Which of the following sequences correctly orders the people of Acaford from the bottom fifth to the top fifth of income distribution? SHARE OF TOTAL INCOME (Percent) 2)arrow_forwardThe Donaldson Furniture Company produces three types of rocking chairs: the children's model, the standard model, and the executive model. Each chair is made in three stages: cutting, construction, and finishing. Stage Cutting Construction Finishing Children's Standard Executive 7 hr 5 hr 4 hr 3 hr 2 hr 5 hr 2 hr 2 hr 4 hr The time needed for each stage of each chair is given in the chart. During a specific week the company has available a maximum of 166 hours for cutting, 106 hours for construction, and 84 hours for finishing. Determine how many of each type of chair the company should make to be operating at full capacity. The number of executive chairs the company should make isarrow_forward
- Southwestern University (SWU), a large state college in Stephenville, Texas, enrolls close to 20,000 students. The school is a dominant force in the small city, with more students during fall and spring than permanent residents. Always a football powerhouse, SWU is usually in the top 20 in college football rankings. Since the legendary Phil Flamm was hired as its head coach in 2009 (in hopes of reaching the elusive number 1 ranking), attendance at the five Saturday home games each year increased. Prior to Flamm's arrival, attendance generally averaged 25,000 to 29,000 per game. Season ticket sales bumped up by 10,000 just with the announcement of the new coach's arrival Stephenville and SWU were ready to move to the big time! The immediate issue facing SWU, however, was not NCAA ranking. It was capacity. The existing SWU stadium, built in 1953, has seating for 54,000 fans. The following table indicates attendance at each game for the past 6 years. Southwestern University Football Game…arrow_forwardA diabetic patient needs at least 40 units of Vit. A, at least 30 units of Vit. C, and atleast 30 units of Vit. E each day. Each brand X multivitamin capsule contains 4 units ofVit. A, 6 units of Vit. C, and 2 units of Vit. E; each brand Y capsule contains 5 units of Vit.A, 3 units of Vit.C, and 5 units of Vit. E. If each brand X capsule costs P6.00 and eachbrand Y capsule costs P9.00, how many capsules should the patient take each day tominimize the costs? Solve using graphical method. Show complete solution.Required:1. Formulate the following:a. Decision variablesb. Objective functionc. Constraints2. Graph3. Identify feasible region.4. Solve for the value of X and Y at each point.5. Decision.arrow_forward3. A magazine publishes a U.S. and a Canadian edition each week. There are 30,000 subscribers in the U.S. and 20,000 subscribers in Canada. Other copies are sold at newsstands. Postage and shipping costs average $80 per thousand copies in the U.S. and $60 per thousand copies in Canada. Surveys show that no more than 120,000 copies of each issue can be sold (including subscriptions) and that the number of copies of the Canadian edition should not exceed twice the number of copies of the U.S. edition. The publisher can spend at most $8400 a month on postage and shipping. If profit is $200 per thousand copies on the U.S. edition and $150 per thousand copies on the Canadian, how many copies of each should be printed to maximize profit, and what will that profit be?arrow_forward
- 1. Morelia Corporation has two assembly plants (in LA and Atlanta) and three distribution centers (St. Louis, Chicago, and Sacramento). The LA plant can produce at most 10,000 units per month, while the Atlanta plant can produce at most 7000 units per month. The St. Louis center must receive at least 5000 units per month, the Chicago center must receive at least 4000 units per month, and the Sacramento center must receive at least 8000 units per month. The costs per unit for transportation from plants to centers are given below. Set up an LP, defining the variables and writing the objective function and all constraints. LA to St. Louis, $3.50 LA to Chicago, 5 LA to Sacramento, 3 Atlanta to St. Louis, 3.50 Atlanta to Chicago, 3.75 Atlanta to Sacramento, 5.50arrow_forwardOHaganBooks.com currently operates three warehouses: one in Washington, one in California, and the new one in Texas. Book inventories are shown in the following table. Sci-Fi Horror Romance Other Total Washington 10,000 12,000 12,000 30,000 64,000 California 8,000 12,000 6,000 16,000 42,000 Техas 15,000 15,000 20,000 44,000 94,000 Total 33,000 39,000 38,000 90,000 200,000 A book is selected at random. Compute the probability of the given event. it is either a sci-fi book or stored in Washington (or both) 335arrow_forwardAn organization estimated that in a particular year the population of a country spent $10.5 trillion in personal consumption. The major categories of these expenditures are durable goods($1.1trillion; for example, cars, furniture, recreational equipment), nondurable goods($2.1trillion; for example, food, clothing, fuel), and services($7.1trillion; for example, health care, education, transportation). Complete parts (a) through (e) below. a. What is the approximate annual per capita spending for personal consumption? Assume a population of 265million. (Round to the nearest dollar as needed.) b. What is the approximate daily per capita spending for personal consumption? (Round to the nearest dollar as needed.) c. On average about what percentage of personal spending is devoted to services? (Round to the nearest percent as needed.) d. Spending on health care was estimated to be$1.1 trillion in that year. About what percentage of all personal…arrow_forward
- The Lawson Fabric Mill Produces five different fabrics. Each fabric can be woven on one or more of the mill’s 36 looms. The sales department’s forecast of demand for the next month is shown in below Table 1, along with data on the selling price per yard, variable cost per yard, and purchase price per yard. The mill operates 24 hours a day and is scheduled for 30 days during the coming month. The mill has two types of looms: draw and regular. The draw looms are more versatile and can be used for all five fabrics. The regular looms can produce only three of the fabrics. The mill has a total of 36 looms: 8 are draw and 28 are regular. The rate of production for each fabric on each type of loom is given in below Table 2. The time required to change over from producing one fabric to another is negligible and does not have to be considered. The Lawson Fabric Mill satisfies all demand with either its own fabric or fabric purchased from another mill. Fabrics that cannot be woven at the…arrow_forwardThe monmouth emergency management agency is charge with providing services to the three types of clients(A,B,C) after a major crisis. A total of 1000 clients are to be served, with 455,000 available for counseling and 285,000 available for food/shelter. Type A clients require an average of 300 for counseling and 400 for food/shelter.Type B clients require an average of 600 counseling and 300 for food/shelter. Type C clients require an average of 400 for counseling and 200 for food/shelter. under there constraints, how many of each type of client can be served?arrow_forwardAnalyze and compare Darden Restaurants to Panera Bread Darden Restaurants, Inc. (DRI) is the largest full-service restaurant company in the world. It operates over 2,200 restaurants under a variety of brand names, including Olive Garden, Bahama Breeze, and LongHorn Steakhouse. Panera Bread Company (PNRA) operates over 1,800 bakery-café locations across North America. It is one of the largest food service companies in the United States. The cost of food, beverage, and packaging and the beginning and ending inventory balances from recent annual reports for Darden and Panera are as follows (in millions): Darden Panera Cost of goods sold (food, beverage, and packaging) $2,039.7 $715.5 Inventories: Beginning of year 163.9 22.8 End of year 175.4 22.5 a. Compute the inventory turnover for both companies. Round all calculations to one decimal place. Inventory Turnover Darden Restaurants fill in the blank 1 Panera Bread fill in the…arrow_forward
 MATLAB: An Introduction with ApplicationsStatisticsISBN:9781119256830Author:Amos GilatPublisher:John Wiley & Sons Inc
 Probability and Statistics for Engineering and th...StatisticsISBN:9781305251809Author:Jay L. DevorePublisher:Cengage Learning
 Statistics for The Behavioral Sciences (MindTap C...StatisticsISBN:9781305504912Author:Frederick J Gravetter, Larry B. WallnauPublisher:Cengage Learning
 Elementary Statistics: Picturing the World (7th E...StatisticsISBN:9780134683416Author:Ron Larson, Betsy FarberPublisher:PEARSON
 The Basic Practice of StatisticsStatisticsISBN:9781319042578Author:David S. Moore, William I. Notz, Michael A. FlignerPublisher:W. H. Freeman
 Introduction to the Practice of StatisticsStatisticsISBN:9781319013387Author:David S. Moore, George P. McCabe, Bruce A. CraigPublisher:W. H. Freeman