
Introduction to Business Statistics
7th Edition
ISBN: 9781111792374
Author: WEIERS
Publisher: Cengage Learning
expand_more
expand_more
format_list_bulleted
Concept explainers
Videos
Textbook Question
Chapter 2, Problem 2.62CE
For the period 2001—2008, the lristol-Myers Squibb Company, Inc. reported the following amounts (in billions of dollars) for (1) net sales and (2) advertising and product promouon. The data are also in the tile XR02062. Source: Bristol-Myers Squibb Company, Annual Reports, 2005, 2008.
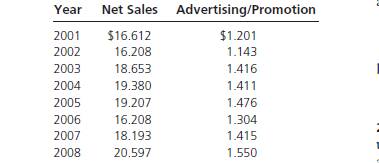
For these data, construct a line graph that shows both net sales and expenditures for advertising/product promotion over time. Some would suggest that increases in advertising should be accompanied by increases in sales. Does your line graph support this?
Expert Solution & Answer
Want to see the full answer?
Check out a sample textbook solution
Students have asked these similar questions
Construct a scatter plot and identify the mathematical model
can a cause and effect relationship be determined?
The spreadsheet at MarathonWinningTimes.xlsx shows the history of the winning
time in the Boston Marathon for men and women from 1966 (when women first ran) through
2013.
What is the average rate at which the men’s finishing time changed from year to year?
Chapter 2 Solutions
Introduction to Business Statistics
Ch. 2.2 - What is a frequency distribution? What benefits...Ch. 2.2 - Prob. 2.2ECh. 2.2 - The National Safety Council reports the following...Ch. 2.2 - Prob. 2.4ECh. 2.2 - Prob. 2.5ECh. 2.2 - Using the frequency distribution in Exercisc 2.5,...Ch. 2.2 - What is meant by the statement that the set of...Ch. 2.2 - For commercial banks in each state, the U.S....Ch. 2.2 - The accompanying data describe the hourly wage...Ch. 2.2 - The following performance scores have been...
Ch. 2.2 - During his career in the NHL, hockey great Wayne...Ch. 2.2 - According to the U.S. Department of Agriculture,...Ch. 2.2 - Convert the distribution in Exercise 2.3 to a...Ch. 2.2 - Prob. 2.14ECh. 2.2 - Using the frequency distribution obtained in...Ch. 2.2 - For the frequency distribution constructed in...Ch. 2.2 - Prob. 2.17ECh. 2.2 - Prob. 2.18ECh. 2.2 - Prob. 2.19ECh. 2.3 - Construct a stem-and-leaf display for the...Ch. 2.3 - Prob. 2.21ECh. 2.3 - In the following stem-and-leaf display for a set...Ch. 2.3 - Prob. 2.23ECh. 2.3 - Prob. 2.24ECh. 2.3 - Prob. 2.25ECh. 2.3 - Prob. 2.26ECh. 2.3 - Prob. 2.28ECh. 2.4 - What is the difference between a histogram and a...Ch. 2.4 - Prob. 2.30ECh. 2.4 - Prob. 2.31ECh. 2.4 - Prob. 2.32ECh. 2.4 - Prob. 2.33ECh. 2.4 - Prob. 2.34ECh. 2.4 - It has been estimated that 92.9% of U.S....Ch. 2.4 - Prob. 2.37ECh. 2.5 - What is a scatterplot, and for what kind of data...Ch. 2.5 - Prob. 2.39ECh. 2.5 - Prob. 2.40ECh. 2.5 - Prob. 2.41ECh. 2.5 - For six local offices of a large tax prepartion...Ch. 2.5 - In the 2009 stress tests applied to the nation’s...Ch. 2.5 - Prob. 2.44ECh. 2.5 - Prob. 2.45ECh. 2.6 - Prob. 2.46ECh. 2.6 - Difference between simple tabulation and...Ch. 2.6 - Prob. 2.48ECh. 2.6 - For the fleet described in Exercise 2.48, a....Ch. 2.6 - Prob. 2.50ECh. 2.6 - Prob. 2.51ECh. 2.6 - Prob. 2.52ECh. 2.6 - Prob. 2.53ECh. 2.6 - Prob. 2.54ECh. 2 - The breakdown of U.S. cities having a population...Ch. 2 - The National Oceanic and Atmospheric...Ch. 2 - Prob. 2.57CECh. 2 - Prob. 2.58CECh. 2 - Prob. 2.59CECh. 2 - Prob. 2.60CECh. 2 - The following stem-and-leaf output has been...Ch. 2 - For the period 2001—2008, the lristol-Myers Squibb...Ch. 2 - Prob. 2.63CECh. 2 - Prob. 2.64CECh. 2 - Prob. 2.65CECh. 2 - Prob. 2.66CECh. 2 - Prob. 2.67CECh. 2 - Prob. 2.68CECh. 2 - Prob. 2.69CECh. 2 - Prob. 2.70CECh. 2 - Using 10-yard intervals beginning with 200.0—under...Ch. 2 - Using the same intervals as in part 1, construct a...Ch. 2 - Prob. 1.3IC
Knowledge Booster


Learn more about
Need a deep-dive on the concept behind this application? Look no further. Learn more about this topic, statistics and related others by exploring similar questions and additional content below.Similar questions
- Describe about the three positive relationships of Scatterplots?arrow_forwardThe Internal Revenue Service Restructuring and Reform Act (RRA) was signed into law by President Bill Clinton in 1998. A major objective of the RRA was to promote electronic filing of tax returns. The data in the table that follows show the percentage of individual income tax returns filed electronically for filing years 2000–2008. Since the percentage P of returns filed electronically depends on the filing year y and each input corresponds to exactly one output, the percentage of returns filed electronically is a function of the filing year;so P(y) represents the percentage of returns filed electronically for filing year y. (a) Find the average rate of change of the percentage of e-filed returns from 2000 to 2002. (b) Find the average rate of change of the percentage of e-filed returns from 2004 to 2006. (c) Find the average rate of change of the percentage of e-filed returns from 2006 to 2008. (d) What is happening to the average rate of change as time passes?arrow_forwardThe Pennsylvania State University had enrollments of 40,571 students in 2000 and 41,289 students in 2004 at its main campus in University Park, Pennsylvania. Assuming the enrollment growth is linear, predict the enrollments in 2008 and 2010.arrow_forward
- uppose Laura, a facilities manager at a health and wellness company, wants to estimate the difference in the average amount of time that men and women spend at the company's fitness centers each week. Laura randomly selects 13 adult male fitness center members from the membership database and then selects 13 adult female members from the database. Laura gathers data from the past month containing logged time at the fitness center for these members. She plans to use the data to estimate the difference in the time men and women spend per week at the fitness center. The sample statistics are summarized in the table. Population Populationdescription Population mean(unknown) Samplesize Sample mean(min) Sample standarddeviation (min) 1 male ?1 ?1=13 ?⎯⎯⎯1=132.5 ?1=45.3 2 female ?2 ?2=13 ?⎯⎯⎯2=108.7 ?2=31.1 df=21.256 The population standard deviations are unknown and unlikely to be equal, based on the sample data. Laura plans to use the two-sample ?-procedures to estimate the…arrow_forwardAn business reviews data on the daily amount of calls it receives. Are the data discrete or continous?arrow_forwardIn 2010, MonsterCollege surveyed 1250 U.S.college students expecting to graduate in the next several years.Respondents were asked the following question:What do you think your starting salary will be at your firstjob after college?The line graph shows the percentage of college students whoanticipated various starting salaries. Use the graph to solveExercises 9–14. What starting salary was anticipated by the greatestpercentage of college students? Estimate the percentage ofstudents who anticipated this salary? What starting salary was anticipated by the least percentageof college students? Estimate the percentage of students whoanticipated this salary? What starting salaries were anticipated by more than 20% ofcollege students? Estimate the percentage of students who anticipated astarting salary of $40 thousand.arrow_forward
- The following table shows the approximate number of wireless telephone subscriptions in recent years.arrow_forwardAn analyst might want to determine whether there is a difference in the cost per mile of airfares in the United States between 1979 and 2009 for various cities. The data in Table represent the costs per mile of airline tickets for a sample of 17 cities for both 1979 and 2009.arrow_forwardIntergarated products Need to estimate its pc sales for the nextnext year. the most recent six years of revenue data for the companys line of xt personal computers and those of the industry, is found in the table below; Year XT PC Sales (000,000) All Industry PC Sales Revenue 1 2.4 4.6 2 5.9 8.6 3 15.5 10.7 4 27.8 14.8 5 35.9 18.5 6 38.1 19.4 a) Assuming that the sales data above are representative of sales expected next year , use time series regression analysis to forecast next years sales b) determine the correlation correlation for he ime forecast and interpret is meaning c) find the coefficient of determination for the time series forecast and intpret it s meaning d) perform a regression analysis between the annual sales revenues of XT Personal computers and all personal computers if the estimate of next years industry PC sales revenues is $21.9 billion? e) which independent variable should intergrated products coporation IPC choose for its forcasting of sales…arrow_forward
arrow_back_ios
SEE MORE QUESTIONS
arrow_forward_ios
Recommended textbooks for you
 MATLAB: An Introduction with ApplicationsStatisticsISBN:9781119256830Author:Amos GilatPublisher:John Wiley & Sons Inc
 Probability and Statistics for Engineering and th...StatisticsISBN:9781305251809Author:Jay L. DevorePublisher:Cengage Learning
 Statistics for The Behavioral Sciences (MindTap C...StatisticsISBN:9781305504912Author:Frederick J Gravetter, Larry B. WallnauPublisher:Cengage Learning
 Elementary Statistics: Picturing the World (7th E...StatisticsISBN:9780134683416Author:Ron Larson, Betsy FarberPublisher:PEARSON
 The Basic Practice of StatisticsStatisticsISBN:9781319042578Author:David S. Moore, William I. Notz, Michael A. FlignerPublisher:W. H. Freeman
 Introduction to the Practice of StatisticsStatisticsISBN:9781319013387Author:David S. Moore, George P. McCabe, Bruce A. CraigPublisher:W. H. Freeman
MATLAB: An Introduction with Applications
Statistics
ISBN:9781119256830
Author:Amos Gilat
Publisher:John Wiley & Sons Inc
Probability and Statistics for Engineering and th...
Statistics
ISBN:9781305251809
Author:Jay L. Devore
Publisher:Cengage Learning
Statistics for The Behavioral Sciences (MindTap C...
Statistics
ISBN:9781305504912
Author:Frederick J Gravetter, Larry B. Wallnau
Publisher:Cengage Learning
Elementary Statistics: Picturing the World (7th E...
Statistics
ISBN:9780134683416
Author:Ron Larson, Betsy Farber
Publisher:PEARSON
The Basic Practice of Statistics
Statistics
ISBN:9781319042578
Author:David S. Moore, William I. Notz, Michael A. Fligner
Publisher:W. H. Freeman
Introduction to the Practice of Statistics
Statistics
ISBN:9781319013387
Author:David S. Moore, George P. McCabe, Bruce A. Craig
Publisher:W. H. Freeman
Points, Lines, Planes, Segments, & Rays - Collinear vs Coplanar Points - Geometry; Author: The Organic Chemistry Tutor;https://www.youtube.com/watch?v=dDWjhRfBsKM;License: Standard YouTube License, CC-BY
Naming Points, Lines, and Planes; Author: Florida PASS Program;https://www.youtube.com/watch?v=F-LxiLSSaLg;License: Standard YouTube License, CC-BY