
Videos
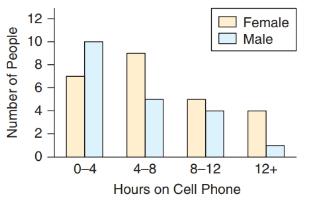
Cell Phone Use Refer to the accompanying bar chart, which shows the time spent on a typical day talking on the cell phone for some men and women. Each person was asked to choose the one of four intervals that best fit the amount of time he or she spent on the phone (for example, “0 to 4 hours” or “12 or more hours”).
a. Identify the two variables. Then state whether they are categorical or numerical and explain.
b. Is the graph a bar chart or a histogram? Which would be the better choice for these data?
c. If you had the actual number of hours for each person, rather than just an interval, what type of graph should you use to display the distribution of the actual numbers of hours?
d. Compare the
Want to see the full answer?
Check out a sample textbook solution
Chapter 2 Solutions
Introductory Statistics (2nd Edition)
Additional Math Textbook Solutions
Introduction to Statistical Quality Control
Elementary Statistics Using the TI-83/84 Plus Calculator, Books a la Carte Edition (4th Edition)
Statistics for Business and Economics (13th Edition)
Elementary Statistics ( 3rd International Edition ) Isbn:9781260092561
Elementary Statistics (13th Edition)
EBK STATISTICAL TECHNIQUES IN BUSINESS


 College Algebra (MindTap Course List)AlgebraISBN:9781305652231Author:R. David Gustafson, Jeff HughesPublisher:Cengage Learning
 Algebra: Structure And Method, Book 1AlgebraISBN:9780395977224Author:Richard G. Brown, Mary P. Dolciani, Robert H. Sorgenfrey, William L. ColePublisher:McDougal Littell
 Glencoe Algebra 1, Student Edition, 9780079039897...AlgebraISBN:9780079039897Author:CarterPublisher:McGraw Hill
 Holt Mcdougal Larson Pre-algebra: Student Edition...AlgebraISBN:9780547587776Author:HOLT MCDOUGALPublisher:HOLT MCDOUGAL