
The impact of the elasticity on the demand and supply of the agricultural products and on its quantity and price.
Explanation of Solution
Due to the inelastic nature of the
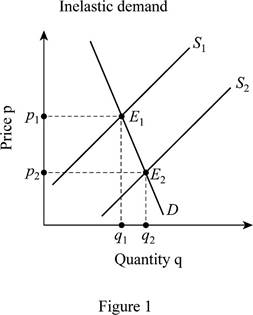
In Figure 1, the demand curve is relatively inelastic as compared to the supply curve. The new equilibrium (E2) shows that there has been a small change in the quantity of the demand with the drastic change in the price.
The volatile nature of the exports increases the instability of the demand for the agricultural products. The exports change from year to year; so, there is an increase in the instability for the demand of the agricultural products.
Concept Introduction
Supply and demand of the agricultural products: The demand for the agricultural products is inelastic in nature because a large change in the prices has a very small impact on the demand for the agricultural products. The supply of the agricultural products is elastic in nature.
Want to see more full solutions like this?
Chapter 22 Solutions
Microeconomics

- 3. Refer to the expanded table below from review question 8. LO3.4 a. What is the equilibrium price? At what price is there nei- ther a shortage nor a surplus? Fill in the surplus-shortage column and use it to confirm your answers. b. Graph the demand for wheat and the supply of wheat. Be sure to label the axes of your graph correctly. Label equi- librium price Pand equilibrium quantity Q. c. How big is the surplus or shortage at $3.40? At $4.90? How big a surplus or shortage results if the price is 60 cents higher than the equilibrium price? 30 cents lower than the equilibrium price? Thousands of Bushels Surplus (+) or Shortage (-) Thousands Price per Bushel of Bushels Supplied Demanded 85 $3.40 72 80 3.70 73 75 4.00 75 70 4.30 77 65 4.60 79 60 4.90 81arrow_forwardADVANCED ANALYSIS Assume that demand for a commodity is represented by the equation P=80−2Qd.P=80−2Qd. Supply is represented by the equation P=−20+2Qs,P=−20+2Qs, where Qd and Qs are quantity demanded and quantity supplied, respectively, and P is price.Instructions: Round your answer for price to 2 decimal places and enter your answer for quantity as a whole number. Using the equilibrium condition Qs = Qd, solve the equations to determine equilibrium price and equilibrium quantity.arrow_forwardNext, complete the following graph, labeled Scenario 2, by shifting the supply and demand curves in the same way that you did on the Scenario 1 graph. PRICE (Dollars per pen) 10 9 8 co LO 5 + 3 2 1 0 0 1 Price Quantity 2 Equilibrium Object True Scenario 2 3 False Supply 4 5 6 7 QUANTITY (Millions of pens) Demand Scenario 1 8 9 Compare both the Scenario 1 and Scenario 2 graphs. Notice that after completing both graphs, you can now see a difference between them that wasn't apparent before the shifts because each graph indicates different magnitudes for the supply and demand shifts in the market for pens. 10 Use the results of your answers on both the Scenario 1 and Scenario 2 graphs to complete the following table. Begin by indicating the overall change in the equilibrium price and quantity after the shift in demand or supply for each shift-magnitude scenario. Then, in the final column, indicate the resulting change in the equilibrium price and quantity when supply and demand shift in…arrow_forward
- 1. Much of the demand for U.S. agricultural output comes from other countries. Suppose that the total demand for wheat in the U.S. wheat market is QDT = 3,244 – 283P, where P is the price measured in dollars per bushel and Q is the quantity of wheat expressed in millions of bushels per year. Of the total demand, total domestic demand was QD,US = 1,700 – 107P. Total supply of wheat in the U.S. market is QST = 1,944 + 207P. As a result of the ongoing trade war with China, suppose the export demand for wheat falls by 40 percent. a. U.S. farmers are concerned about this drop in export demand. How does this drop in export demand impact the market price of wheat in the U.S.? Do farmers have much reason to worry? Explain/support your answer. b. How does the reduction in export demand affect U.S. consumer surplus in the wheat market? Illustrate and explain. c. Now, suppose the U.S. government wants to buy enough wheat to raise the price to $3.50 per bushel. With the drop in export…arrow_forwardADVANCED ANALYSIS Assume that demand for a commodity is represented by the equation P = 80 – 2Qd. Supply is represented by the equation P = -20 + 2Qs, where Qgand Qg are quantity demanded and quantity supplied, respectively, and Pis price. Instructions: Round your answer for price to 2 decimal places and enter your answer for quantity as a whole number. Using the equilibrium condition Qs = Qd, solve the equations to determine equilibrium price and equilibrium quantity. Equilibrium price = $ Equilibrium quantity = unitsarrow_forwardADVANCED ANALYSIS Assume that demand for a commodity is represented by the equation P = 20 – 2Qd. Supply is represented by the equation P = -5 + 3Qs, where Qgand Qs are quantity demanded and quantity supplied, respectively, and Pis price. Instructions: Round your answer for price to 2 decimal places and enter your answer for quantity as a whole number. Using the equilibrium condition Qs= Qd solve the equations to determine equilibrium price and equilibrium quantity. Equilibrium price = $ Equilibrium quantity = unitsarrow_forward
- Suppose that the world price of oil is $70 per barrel and that the United States can buy all the oil it wants at this price. Suppose also that the demand and supply schedules for oil in the United Sta follows: Price ($ per Barrel) 55 60 65 70 75 U.S. Quantity Demanded 26 24 22 20 18 U.S. Quantity Supplied 14 16 18 20 22 Now suppose that the United States allows no oil imports. The equilibrium price in the United states is $ 70 per barrel and the equilibrium quantity is 20 million barrels. If the United States imposed a price ceiling of $65 per barrel on the oil market and prohibited imports, there would be an of million barrels of oil. excess supply excess demandarrow_forwardWill the equilibrium price of orange juice increase or decrease in each of the following situations? LO7a. A medical study reporting that orange juice reduces cancer is released at the same time that a freak storm destroys half of the orange crop in Florida. The prices of all beverages except orange juice fall in half while unexpectedly perfect weather in Florida results in an orange crop that is 20 percent larger than normal.arrow_forward1. Plot the graph of the demand and supply schedule below, determine the equilibrium quantity and equilibrium price, and label each curve. Supply & Demand Schedule for Rice Price per Kilo (in Quantity Supplied (in Quantity Demanded pesos) kg) (in kg) 39 100 350 44 150 300 46 200 200 48 250 150 50 300 100 52 350 50 As shown in Table above, plot the hypothetical supply and demand schedule for rice at various prices. Based from the given variables, determine the following. 1. Equilibrium Price (EP) 2. Equilibrium Quantity Supplied (EQS ) 3. Equilibrium Quantity Demanded (EQD)arrow_forward
- 4. How will each of the following changes in demand and/or supply affect equilibrium price and equilibrium quantity in a competitive market; that is, do price and quantity rise, fall, or remain unchanged, or are the answers indeterminate be- cause they depend on the magnitudes of the shifts? Use sup- ply and demand to verify your answers. LO3.5 a. Supply decreases and demand is constant. b. Demand decreases and supply is constant. c. Supply increases and demand is constant. d. Demand increases and supply increases. e. Demand increases and supply is constant. f. Supply increases and demand decreases.arrow_forwardThe data in the table below are for kilos of prawns. Price $24 26 28 30 32 34 36 Quantity Demanded 270 250 230 190 170 150 New equilibrium price: Quantity Supplied (before tax) LA 210 230 240 250 260 270 a) What is the present equilibrium price and quantity? Equilibrium price: $ Equilibrium quantity: b) Complete the Quantity Supplied (after tax) that results. c) What will be the new equilibrium price and quantity? New equilibrium quantity: Quantity Supplied (after tax) Suppose that the government Introduces a $6 excise tax on prawns. 4arrow_forwardMa3. 15) The US. has run down the nation's SPB, Strategic Petroleum Reserve, to levels not seen it since March 1984! At1.0million bbls per day, what was the impact on the global oil price if there was no countermeasure employed by OPEC+? Knowing that Russian oil production has declined and is expected to be1.1million bbls per day less than prewar levels AND the 1.0 million bbls per day that are coming off the market due to the end of the SPB release-let's say in March 2023. What do you expect to happen to the price of oil?arrow_forward

 Principles of Economics (12th Edition)EconomicsISBN:9780134078779Author:Karl E. Case, Ray C. Fair, Sharon E. OsterPublisher:PEARSON
 Engineering Economy (17th Edition)EconomicsISBN:9780134870069Author:William G. Sullivan, Elin M. Wicks, C. Patrick KoellingPublisher:PEARSON
 Principles of Economics (MindTap Course List)EconomicsISBN:9781305585126Author:N. Gregory MankiwPublisher:Cengage Learning
 Managerial Economics: A Problem Solving ApproachEconomicsISBN:9781337106665Author:Luke M. Froeb, Brian T. McCann, Michael R. Ward, Mike ShorPublisher:Cengage Learning
 Managerial Economics & Business Strategy (Mcgraw-...EconomicsISBN:9781259290619Author:Michael Baye, Jeff PrincePublisher:McGraw-Hill Education