
Excel Applications for Accounting Principles
4th Edition
ISBN: 9781111581565
Author: Gaylord N. Smith
Publisher: Cengage Learning
expand_more
expand_more
format_list_bulleted
Concept explainers
Videos
Textbook Question
Chapter 24, Problem 4R
The worksheet you have developed will handle most simple variance analysis problems. Try the problem below for Pscheidl, Inc.:
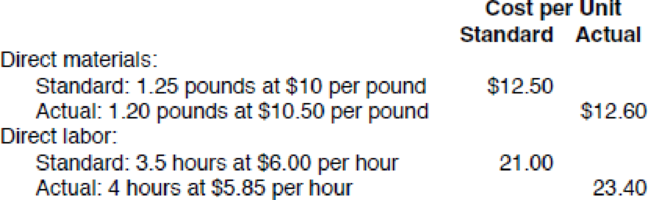
Actual production for October was 11,500 units. Compute the direct materials and direct labor variances for Pscheidl, Inc. Be careful when entering your input because this problem presents the information in a different format from the McGrade Industries’ data. Save the file as PRIMEVAR4. Print the worksheet when done.
Expert Solution & Answer

Trending nowThis is a popular solution!

Students have asked these similar questions
Best, Inc. uses a standard cost system and provides the following information. (Click the icon to view the
information.) variable overhead, $3,800; actual fixed overhead, $3, 500; actual direct labor hours, 1,400.
Read the requirements. Data table Requirement 1. Compute the variable overhead cost and efficiency
variances and fixed overhead cost and volume variances. Begin with the variable overhead cost and
efficiency variances. Select the required formulas, compute the variable overhead cost and favorable (F) or
unfavorable (U). (Abbreviations used: AC = actual cost; AQ = actual quantity; FOH = fixed overhead;
SC = standardco \table [[,, Formula,Variance], [VOH cost variance, = , 1 = , ], [VOH efficiency variance, =,1 =, 0
Complete the table below for the missing variances.
1(Click
the icon to view the table.)
Calculate the variances and identify whether the variance is favorable (F) or unfavorable (U).
(b) Total Direct Materials Variance
$125
F
(c) Total Direct Labor Variance
$255
F
(e) Total Variable Overhead Variance
$175
F
(f) Total Fixed Overhead Variance
(1) F
(d) Total Manufacturing Overhead Variance
(2) F
(a) Total Flexible Budget Product Cost Variance
(3) F
1: Data Table
Total Flexible Budget Product Cost Variance
(a)
Total Direct
Total Direct
Total Manufacturing
Materials Variance
Labor Variance
Overhead Variance
(b)
(c)
(d)
Direct Materials
Direct Materials
Direct Labor
Direct Labor…
A computer system queues up batch jobs and processes them on an FCFS basis.Between 2 and 5 P.M., jobs arrive at an average rate of 30 per hour and require anaverage of 1.2 minutes of computer time. Assume the arrival process is Poissonand the processing times are exponentially distributed.
a. Compute the variance of the flow times assuming FCFS, LCFS, and randomselection disciplines
Chapter 24 Solutions
Excel Applications for Accounting Principles
Knowledge Booster


Learn more about
Need a deep-dive on the concept behind this application? Look no further. Learn more about this topic, accounting and related others by exploring similar questions and additional content below.Similar questions
- The president of McGrade Industries wants an analysis prepared to help explain why the variances computed in requirement 1 occurred. Using the worksheet called PRIMEVAR that follows these requirements, calculate the material and labor variances for McGrade Industries. The problem requires you to enter the input in the Data Section as well as formulas in the Answer Section.arrow_forwardClose the PRIMEVAR4 file and open PRIMEVAR3. Click the Chart sheet tab. On the screen is a graphical representation of the variances computed in requirement 3. Review the chart and answer the following questions: a. Which variances does each bar represent? A __________ B __________ C __________ D __________ b. Which of the variances shown would be of most concern to management for immediate attention? (Consider groups of variances and materiality also.) Explain. When the assignment is complete, close the file without saving it again. Worksheet. McGrade Industries also has the following information regarding overhead for October: actual overhead 375,000, standard variable overhead of 3 per direct labor hour, and standard fixed overhead of 5 per direct labor hour (based on 47,000 hours budgeted). Modify the PRIMEVAR3 worksheet to compute all appropriate overhead variances. Preview the printout to make sure that the worksheet will print neatly on one page, and then print the worksheet. Save the completed file as PRIMEVART. Hint: Insert several new rows in the Data Section and in the Answer Section. Chart. Using the PRIMEVAR3 file, prepare a 3-D stacked bar chart to compare total standard cost per unit with actual cost per unit. Complete the Chart Tickler Data Table and use it as a basis for preparing the chart. You do not need to use cell references when completing the table. Enter all appropriate titles, legends, and formats. Enter your name somewhere on the chart. Save the file again as PRIMEVAR3. Print the chart.arrow_forwardDownload the Applying Excel form and enter formulas in all cells that contain question marks. For example, in cell B30 enter the formula "= B20". Notes: In the text, variances are always displayed as positive numbers. To accomplish this, you can use the ABS() function in Excel. For example, the formula in cell C31 would be "=ABS(E31-B31)". Cells D31 through D39 and G31 through G39 already contain formulas to compute and display whether variances are Favorable or Unfavorable. Do not enter data or formulas into those cells-if you do, you will overwrite these formulas. After entering formulas in all of the cells that contained question marks, verify that the amounts match the numbers in the example in the text. Required: 1. Check your worksheet by changing the revenue in cell D4 to $16.00; the cost of ingredients in cell D5 to $6.50; and the wages and salaries in cell B6 to $10,000. The activity variance for net operating income should now be $850 U and the spending variance for total…arrow_forward
- A1 fr Chapter 10: Applying Excel A В D E F 1 Chapter 10: Applying Excel 3 Data 4 Exhibit 10-1: Standard Cost Card Standard Quantity 2.9 pounds 5 Inputs Standard Price 6 Direct materials 7 Direct labor 8 Variable manufacturing overhead $4.00 per pound $22.00 per hour $6.00 per hour 0.60 hours 0.60 hours 9. 10 Actual results: Actual output Actual variable manufacturing overhead cost 13 2,000 units $7,140 Actual Quantity 6,500 pounds 11 12 Actual price $3.80 per pound $21.60 per hour 14 Actual direct materials cost 15 Actual direct labor cost 1,050 hours 16 17 Enter a formula into each of the cells marked with a ? below 18 Main Example: Chapter 10 19 20 Exhibit 10-4: Standard Cost Variance Analysis- Direct Materials 21 Standard Quantity Allowed for the Actual Output, at Standard Price 22 Actual Quantity of Input, at Standard Price 23 Actual Quantity of Input, at Actual Price 24 Direct materials variances: ? pounds x ? pounds x ? pounds x ? per pound = ? per pound = ? per pound = 25…arrow_forwardBill Wilson, the financial accountant at Robson Ltd is considering implementing a standard costing system. He has asked your advice on the following: a) Setting standards b) Investigating variances c) Taking corrective action on large variances Required: Prepare a short report for Bill addressing these three areas.arrow_forwardData table Last month, CenterWare reported the following actual results for the production of 70,000 bottles: Direct materials..... 1.5 kg per bottle, at a cost of $0.70 per kg Direct labour...... . 1/4 hour per bottle, at a cost of $13.20 per hour Actual variable overhead. ......... $104,600 Actual fixed overhead... $28,700 Done Data table The company has these standards: Direct materials (clay) 1.3 kg per bottle, at a cost of $0.40 per kg Direct labour... 1/5 hour per bottle, at a cost of $14.40 per hour Static budget variable overhead ......... $70,500 Static budget fixed overhead.... .... $30,500 Static budget direct labour hours......... 10,000 hours Static budget number of bottles.......... 52,000 CenterWare allocates manufacturing overhead to production based on standard direct labour hours. Print Done I Printarrow_forward
- You brought your work home one evening, and your nephew spilled his chocolate milk shake on the variance report you were preparing. Fortunately, knowing that overhead was applied based on machine hours, you were able to reconstruct the obliterated information from the remaining data. Fill in the missing numbers below. Note: Round your per machine hour and per unit answers to two decimal places. Indicate the effect of the variance by selecting "Positive" or "Negative". Select "None" and enter "0" for no effect (i.e., zero variance). Standard Machine hours per unit of output 5 hours Standard Variable-overhead rate per machine hour $9 Actual variable-overhead rate per mchine hours ? Actual machine hours per unit of output ? Budgeted fixed overhead $27,500 Actual fixed overhead ? Budgeted production in units 11,000 Actual production in units…arrow_forwardPlease help me with the functions needed to populate the correct answers in the highlighted areas. Thank you! Accessibility tab summary: Financial information for Patterson Incorporated, is presented in cells A4 to G14 and rows 16 to 17. A statement of requirement is presented in rows 19 to 24. A table for Standard Cost Variance Analysis - Direct Materials for student presentation is presented in cells A26 to B29 and A31 to C32. A table for Standard Cost Variance Analysis - Variable Manufacturing Overhead for student presentation is presented in cells A43 to B45 and A47 to C48. A statement of requirement is presented in row 50. A table for student presentation is presented in cell A52 to E62. Standards for one of Patterson, Inc.'s products is shown below, along with actual cost data for the month: Direct materials: Standard 2.4 yards @ $2.75 per yard $6.60 Actual 3.0 yards @ $2.70 per yard $8.10 Direct…arrow_forwardIn a manufacturing process the assembly line speed (feet per minute) was thought to affect the number of defective parts found during the inspection process. To test this theory, managers devised a situation in which the same batch of parts was inspected visually at a variety of line speeds. They collected the following data: Develop a scatter chart with line speed as the independent variable. What does the scatter chart indicate about the relationship between line speed and the number of defective parts found? Use the data to develop an estimated regression equation that could be used to predict the number of defective parts found, given the line speed. What is the estimated regression model? Test whether each of the regression parameters β0 and β1 is equal to zero at a 0.01 level of significance. What are the correct interpretations of the estimated regression parameters? Are these interpretations reasonable? How much of the variation in the number of defective parts found for the sample data does the model you estimated in part (b) explain?arrow_forward
- You brought your work home one evening, and your nephew spilled his chocolate milk shake on the variance report you were preparing. Fortunately, knowing that overhead was applied based on machine hours, you were able to reconstruct the obliterated information from the remaining data. Fill in the missing numbers below. (Round your per machine hour and per unit answers to two decimal places. Indicate the effect of the variance by selecting "Positive" or "Negative". Select "None" and enter "O" for no effect (i.e., zero variance).) Standard machine hours per unit of output 3 hours Standard variable-overhead rate per machine hour 10.00 Actual variable-overhead rate per machine hour Actual machine hours per unit of output Budgeted fixed overhead Actual fixed overhead Budgeted production in units Actual production in units Variable-overhead spending variance Variable-overhead efficiency variance $ 24,975 18,500 $ 68,600 Unfavorable $ 50,000 Favorable Fixed-overhead budget variance $ 15,000…arrow_forwardIn the book Advanced Managerial Accounting, Robert P. Magee discusses monitoring cost variances. A cost variance is the difference between a budgeted cost and an actual cost. Magee describes the following situation: Michael Bitner has responsibility for control of two manufacturing processes. Every week he receives a cost variance report for each of the two processes, broken down by labor costs, materials costs, and so on. One of the two processes, which we'll call process A , involves a stable, easily controlled production process with a little fluctuation in variances. Process B involves more random events: the equipment is more sensitive and prone to breakdown, the raw material prices fluctuate more, and so on. "It seems like I'm spending more of my time with process B than with process A," says Michael Bitner. "Yet I know that the probability of an inefficiency developing and the expected costs of inefficiencies are the same for the two processes. It's just the magnitude of…arrow_forwardI. Krueger Corporation in Washington, D.C., U.S., recently implemented a standard cost system. The company's cost accountant has gathered the following information needed to perform a variance analysis at the end of the month: Standard Cost Information Direct materials .... Quantity allowed per unit . Direct labor rate .... Hours allowed per unit .. Fixed overhead budgeted . Normal level of production. Variable overhead application rate.. Fixed overhead application rate ($12,000 _ 1,200 units)... 10.00 per unit Total overhead application rate..... .. $5 per pound .100 pounds per unit $20.00 per hour . 2 hours per unit $12,000 per month 1,200 units $ 2.00 per unit $12.00 per unit Actual Cost Information Cost of materials purchased and used... Pounds of materials purchased and used . Cost of direct labor.. Hours of direct labor.. $468,000 .104,000 pounds $46,480 . 2,240 hours $2,352 .$12,850 .1,000 units Cost of variable overhead Cost of fixed overhead . Volume of production.…arrow_forward
arrow_back_ios
SEE MORE QUESTIONS
arrow_forward_ios
Recommended textbooks for you
 Excel Applications for Accounting PrinciplesAccountingISBN:9781111581565Author:Gaylord N. SmithPublisher:Cengage Learning
 Essentials of Business Analytics (MindTap Course ...StatisticsISBN:9781305627734Author:Jeffrey D. Camm, James J. Cochran, Michael J. Fry, Jeffrey W. Ohlmann, David R. AndersonPublisher:Cengage Learning
Excel Applications for Accounting Principles
Accounting
ISBN:9781111581565
Author:Gaylord N. Smith
Publisher:Cengage Learning
Essentials of Business Analytics (MindTap Course ...
Statistics
ISBN:9781305627734
Author:Jeffrey D. Camm, James J. Cochran, Michael J. Fry, Jeffrey W. Ohlmann, David R. Anderson
Publisher:Cengage Learning
What is variance analysis?; Author: Corporate finance institute;https://www.youtube.com/watch?v=SMTa1lZu7Qw;License: Standard YouTube License, CC-BY