
Videos
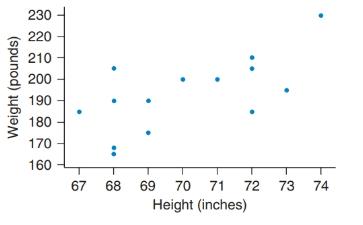
Heights and Weights of Men The table shows the heights (in inches) and weights (in pounds) of 14 college men. The
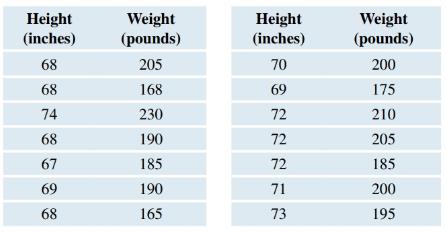
a. Find the equation for the regression line with weight (in pounds) as the response and height (in inches) as the predictor. Report the slope and the intercept of the regression line, and explain what they show. If the intercept is not appropriate to report, explain why.
b. Find the
c. Find the coefficient of determination and interpret it.
d. If you changed each height to centimeters by multiplying heights in inches by 2.54, what would the new correlation be? Explain.
e. Find the equation with weight (in pounds) as the response and height (in inches) as the predictor, and interpret the slope.
f. Summarize what you found: Does changing units change the correlation? Does changing units change the regression equation?
Want to see the full answer?
Check out a sample textbook solution
Chapter 4 Solutions
Introductory Statistics (2nd Edition)
Additional Math Textbook Solutions
Fundamentals of Statistics (5th Edition)
Stats: Modeling the World Nasta Edition Grades 9-12
Elementary Statistics ( 3rd International Edition ) Isbn:9781260092561
Developmental Mathematics (9th Edition)
Elementary Statistics: Picturing the World (6th Edition)
Business Statistics: A First Course (8th Edition)


- Demand for Candy Bars In this problem you will determine a linear demand equation that describes the demand for candy bars in your class. Survey your classmates to determine what price they would be willing to pay for a candy bar. Your survey form might look like the sample to the left. a Make a table of the number of respondents who answered yes at each price level. b Make a scatter plot of your data. c Find and graph the regression line y=mp+b, which gives the number of respondents y who would buy a candy bar if the price were p cents. This is the demand equation. Why is the slope m negative? d What is the p-intercept of the demand equation? What does this intercept tell you about pricing candy bars? Would you buy a candy bar from the vending machine in the hallway if the price is as indicated. Price Yes or No 50 75 1.00 1.25 1.50 1.75 2.00arrow_forwardSales Barnes & Noble had annual sales of $6.8 billion in 2013 and $6.1 billion in 2015. Use the Midpoint Formula to estimate the sales in 2014. Assume that the annual sales followed a linear pattern.arrow_forwardWhat is interpolation when using a linear model?arrow_forward
- Life Expectancy The following table shows the average life expectancy, in years, of a child born in the given year42 Life expectancy 2005 77.6 2007 78.1 2009 78.5 2011 78.7 2013 78.8 a. Find the equation of the regression line, and explain the meaning of its slope. b. Plot the data points and the regression line. c. Explain in practical terms the meaning of the slope of the regression line. d. Based on the trend of the regression line, what do you predict as the life expectancy of a child born in 2019? e. Based on the trend of the regression line, what do you predict as the life expectancy of a child born in 1580?2300arrow_forwardFind the equation of the regression line for the following data set. x 1 2 3 y 0 3 4arrow_forward
 Functions and Change: A Modeling Approach to Coll...AlgebraISBN:9781337111348Author:Bruce Crauder, Benny Evans, Alan NoellPublisher:Cengage Learning
 Algebra and Trigonometry (MindTap Course List)AlgebraISBN:9781305071742Author:James Stewart, Lothar Redlin, Saleem WatsonPublisher:Cengage Learning
 Calculus For The Life SciencesCalculusISBN:9780321964038Author:GREENWELL, Raymond N., RITCHEY, Nathan P., Lial, Margaret L.Publisher:Pearson Addison Wesley,
 Algebra & Trigonometry with Analytic GeometryAlgebraISBN:9781133382119Author:SwokowskiPublisher:Cengage
 College Algebra (MindTap Course List)AlgebraISBN:9781305652231Author:R. David Gustafson, Jeff HughesPublisher:Cengage Learning
 Glencoe Algebra 1, Student Edition, 9780079039897...AlgebraISBN:9780079039897Author:CarterPublisher:McGraw Hill