
Biology: The Unity and Diversity of Life (MindTap Course List)
15th Edition
ISBN: 9781337408332
Author: Cecie Starr, Ralph Taggart, Christine Evers, Lisa Starr
Publisher: Cengage Learning
expand_more
expand_more
format_list_bulleted
Concept explainers
Videos
Textbook Question
Chapter 44, Problem 4CT
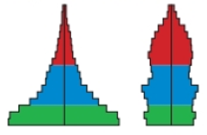
The age structure diagrams for two hypothetical populations are shown below. Describe the growth rate of each population and discuss the current and future social and economic problems that each is likely to face.
Expert Solution & Answer

Trending nowThis is a popular solution!

Students have asked these similar questions
The following equation is used to calculate the population growth rate, Ro, per generation from a life
table. Iy is survival probability from birth to age x and my is fecundity at age x.
Ro = Elkm
Multiplying ly and my and summing it over all age categories in the life table gives the population growth
rate per generation because:
Calculating the reproductive output for each age class requires considering the survival probability to
that age (a dead individual does not reproduce) and the fecundity at that age by multiplying them
with each other. Summing over reproductive output for all age classes gives the total per capita
growth rate of the population
The fecundity at each age is lower when the survival is higher because of energy constraints.
Multiplying probability of survival and fecundity in each age class takes this trade-off into account.
Summing over reproductive output for all age classes gives the total per capita growth rate of the
population
The resulting type of growth…
Two stable populations employ the same fertility schedule, but different mortality schedule. In both
populations, 20% of women between exact ages 45-55 bear a
female child annually. No child bearing occurs outside this span. In population A, there is no
mortality until age 100 where all who reached age perish.
In population B, 1% of each cohort dies within each single year of age with no
survivors beyond age 100. Compute GRR, GRR and r for each population.
ii)
Determine the birth and death rate of each.
Sketch the age distribution of each.
Which compares to the age structure of less developed and higher developed countries, specifying the x and y axis. Give an example of natioins with these types of age structure diagrams. What does a high fertility rate tell you about the future of this population.
Chapter 44 Solutions
Biology: The Unity and Diversity of Life (MindTap Course List)
Ch. 44 - Iguana Decline In 1987, Martin Wikelski began a...Ch. 44 - Iguana Decline In 1987, Martin Wikelski began a...Ch. 44 - Iguana Decline In 1987, Martin Wikelski began a...Ch. 44 - Most commonly, individuals of a population show a...Ch. 44 - The rate at which population size grows or...Ch. 44 - Suppose 200 fish are marked and released in a...Ch. 44 - Prob. 4SQCh. 44 - For a given species, the maximum rate of increase...Ch. 44 - ______ is a density-independent factor that...Ch. 44 - Prob. 7SQ
Ch. 44 - Prob. 8SQCh. 44 - The human population is now about 7 billion. It...Ch. 44 - Prob. 10SQCh. 44 - Prob. 11SQCh. 44 - Prob. 12SQCh. 44 - The demographic transition model predicts a...Ch. 44 - Prob. 14SQCh. 44 - Match each term with its most suitable...Ch. 44 - Think back to Section 44.6. When researchers moved...Ch. 44 - Mountain gorillas are a highly endangered primate...Ch. 44 - Bluebirds are songbirds that, like wood ducks,...Ch. 44 - The age structure diagrams for two hypothetical...
Additional Science Textbook Solutions
Find more solutions based on key concepts
What were the major microbiological interests of Martinus Beijerinck and Sergei Winogradsky? It can be said tha...
Brock Biology of Microorganisms (14th Edition)
Visit this site (http://openstaxcollege.org/l/heartvalve) to observe an echocardiogram of actual heart valves o...
Anatomy & Physiology
Sea turtles have disappeared from many regions, and one way of trying to save them is to reintroduce them to ar...
MARINE BIOLOGY
11. In the early 1800s, French naturalist Jean Baptiste Lamarck suggested that the best explanation for the rel...
Campbell Biology: Concepts & Connections (9th Edition)
Knowledge Booster


Learn more about
Need a deep-dive on the concept behind this application? Look no further. Learn more about this topic, biology and related others by exploring similar questions and additional content below.Similar questions
- Draw a graph with a growth curve for a population that starts at 10 individuals and experiences exponential growth. Draw a second graph with a growth curve for a population that starts with 10 individuals and undergoes logistic growth. The second graph should have a carrying capacity of 100 individuals. Please give a proper written explanation for the graphs.arrow_forwardexplain why a population that fits the logistic growthmodel increases more rapidly at intermediate size thanat relatively small and large sizesarrow_forwardIf the population of 150 squirrels at UofL has 15 births this year, what is the per capita birth rate? - 0.1 squirrels/yr/squirrel If the population of 150 squirrels at UofL has 10 deaths this year, what is per capita death rate? - 0.067 squirrels/yr/squirrel Calculate the intrinsic rate of increase for this squirrel population, using your answers to the questions above. - 0.03 squirrels/yr/squirrel Between having plenty of shelter in the trees and scavenging through the campus garbage, UofL squirrels have seemingly unlimited resources. Using the information you've calculated so far, determine the growth increment for the coming year for the UofL squirrel population. - 4.5 squirrels/yr Let's say that, after you calculated your predictions for unlimited growth of the UofL squirrel populations in the questions above, a bad storm comes through campus and wipes out half the trees! Now, the growth of the population of squirrels becomes limited. There are still 150 squirrels, but the…arrow_forward
- The chart below shows selected population data for twodifferent countries, A and B. Study the chart and answerthe questions that follow Calculate the rates of natural increase (due to birthsand deaths, not counting immigration) for the populations of country A and country B. Based on thesecalculations and the data in the table, for each of thecountries, suggest whether it is a more-developedcountry or a less-developed country and explain thereasons for your answersarrow_forwardHelp mearrow_forwardExamine the age structure diagram. This diagram best represents a population that is: 100+ Male Female 01% |0.2% C.6% 95-99 9D-94 03% 1.% 19% 22% 1.3% 75-79 1.7% 70-74 23% 2.7% 65-69 2.7% 3.0% 60-64 3.0% 3.3% 55-59 3.5% 3.7% 5D-54 3.8% 3.9% 4549 4.0% 39% 4044 3.6% 3.8% 35-39 3.4% 3.4% 3D 34 3.0% 2.9% 25-29 2.8% 2.6% 2D24 2.% 2.5% 15-19 2.5% 2.4% 10-14 2.6% 2.5% 5-9 25% 2.5% 2.0% 2% 4% 0-4 22% 10% 10% Southern Europe - 2019 Population: 152,446,950 PopulalionPyramid.net growing quickly growing slowly not growing/is stable decliningarrow_forward
- Show the vanishing population with diagram of age pyramid.arrow_forwardUsing the above graph, what is the approximate percent of the population in the US and Kenya that is under the age of 15? (number order represents US, Kenya)arrow_forwardContrast exponential and logistic (= sigmoid) growth of a population. Under what conditions might you expect a population to exhibit ex-ponential growth? Why can exponential growth not be perpetuated indefinitely?arrow_forward
- Write a generalized model for exponential population growth. Define your terms. Then, draw a plot showing an example, being sure to label your axes.arrow_forwardName two density-dependent and two densityindependent factors that can limit the size of a population.arrow_forwardWrite a generalized model for exponential population growth. Define your terms. Then, draw a plot showing an example, being sure to label your axes. Write a formula that extends the preceding model to incorporate carrying capacity, producing sigmoidal population growth. Define your terms. Then, draw a plot showing an example, being sure to label your axes.arrow_forward
arrow_back_ios
SEE MORE QUESTIONS
arrow_forward_ios
Recommended textbooks for you
 Human Anatomy & Physiology (11th Edition)BiologyISBN:9780134580999Author:Elaine N. Marieb, Katja N. HoehnPublisher:PEARSON
 Biology 2eBiologyISBN:9781947172517Author:Matthew Douglas, Jung Choi, Mary Ann ClarkPublisher:OpenStax
 Anatomy & PhysiologyBiologyISBN:9781259398629Author:McKinley, Michael P., O'loughlin, Valerie Dean, Bidle, Theresa StouterPublisher:Mcgraw Hill Education,
 Molecular Biology of the Cell (Sixth Edition)BiologyISBN:9780815344322Author:Bruce Alberts, Alexander D. Johnson, Julian Lewis, David Morgan, Martin Raff, Keith Roberts, Peter WalterPublisher:W. W. Norton & Company
 Laboratory Manual For Human Anatomy & PhysiologyBiologyISBN:9781260159363Author:Martin, Terry R., Prentice-craver, CynthiaPublisher:McGraw-Hill Publishing Co.
 Inquiry Into Life (16th Edition)BiologyISBN:9781260231700Author:Sylvia S. Mader, Michael WindelspechtPublisher:McGraw Hill Education
Human Anatomy & Physiology (11th Edition)
Biology
ISBN:9780134580999
Author:Elaine N. Marieb, Katja N. Hoehn
Publisher:PEARSON
Biology 2e
Biology
ISBN:9781947172517
Author:Matthew Douglas, Jung Choi, Mary Ann Clark
Publisher:OpenStax
Anatomy & Physiology
Biology
ISBN:9781259398629
Author:McKinley, Michael P., O'loughlin, Valerie Dean, Bidle, Theresa Stouter
Publisher:Mcgraw Hill Education,
Molecular Biology of the Cell (Sixth Edition)
Biology
ISBN:9780815344322
Author:Bruce Alberts, Alexander D. Johnson, Julian Lewis, David Morgan, Martin Raff, Keith Roberts, Peter Walter
Publisher:W. W. Norton & Company
Laboratory Manual For Human Anatomy & Physiology
Biology
ISBN:9781260159363
Author:Martin, Terry R., Prentice-craver, Cynthia
Publisher:McGraw-Hill Publishing Co.
Inquiry Into Life (16th Edition)
Biology
ISBN:9781260231700
Author:Sylvia S. Mader, Michael Windelspecht
Publisher:McGraw Hill Education
POPULATION REGULATION AND LIMITING FACTORS | DENSITY INDEPENDENT AND DENSITY DEPENDENT FACTORS; Author: BioVidyalaya;https://www.youtube.com/watch?v=mB-AB-5Wnhs;License: Standard YouTube License, CC-BY
Population growth; Author: SiouxScience;https://www.youtube.com/watch?v=XnaC9iOumVA;License: Standard YouTube License, CC-BY