
Concept explainers
The classification of soil based on United States department of agriculture textural classification chart.
Answer to Problem 5.1P
The classification of soil A as per the United States department of agriculture textural classification chart is
The classification of soil B as per the United States department of agriculture textural classification chart is
The classification of soil C as per the United States department of agriculture textural classification chart is
The classification of soil D as per the United States department of agriculture textural classification chart is
The classification of soil E as per the United States department of agriculture textural classification chart is
The classification of soil F as per the United States department of agriculture textural classification chart is
The classification of soil G as per the United States department of agriculture textural classification chart is
The classification of soil H as per the United States department of agriculture textural classification chart is
The classification of soil I as per the United States department of agriculture textural classification chart is
The classification of soil J as per the United States department of agriculture textural classification chart is
Explanation of Solution
Calculation:
Consider soil A:
Refer Figure (5.1) “U.S. Department of agriculture textural classification (USDA)”
in the text book.
Mark the percentage of sand for soil A as 20 %, percentage of silt as 20 %, and percentage of clay as 60 % in Figure (5.1) and mark the point of intersection of three lines.
Show the percentage of sand, silt, and clay of soil A as in Figure (1).
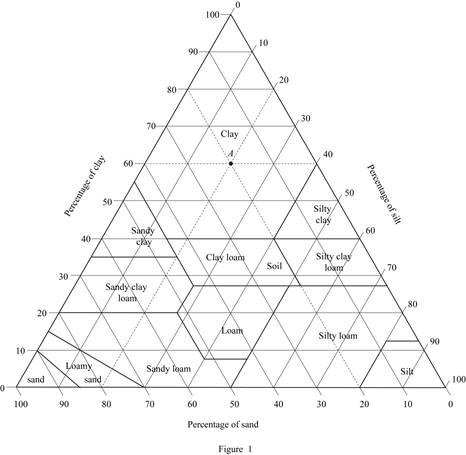
Refer Figure (1).
Hence, the classification of soil A as per the United States department of agriculture textural classification chart is
Consider soil B:
Mark the percentage of sand for soil B as 55 %, percentage of silt as 5 %, and percentage of clay as 40 % in Figure (5.1) and mark the point of intersection of three lines.
Show the percentage of sand, silt, and clay of soil B as in Figure (2).
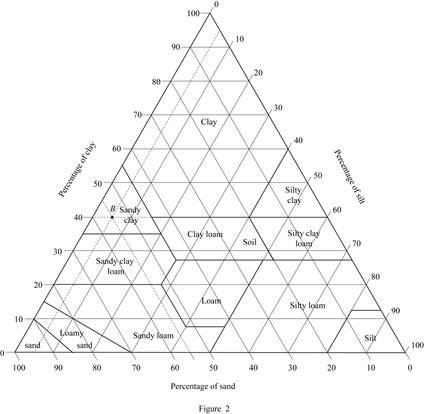
Refer Figure (2).
Thus, classification of soil B as per the United States department of agriculture textural classification chart is
Consider soil C:
Mark the percentage of sand for soil C as 45 %, percentage of silt as 35 %, and percentage of clay as 20 % in Figure (5.1) and mark the point of intersection of three lines.
Show the percentage of sand, silt, and clay of soil C as in Figure (3).
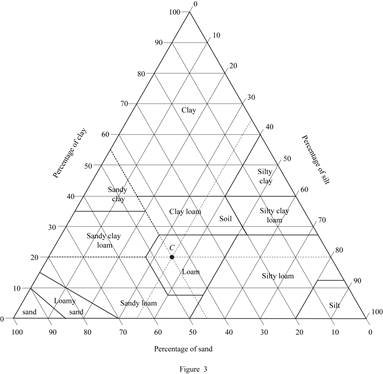
Refer Figure (3).
The classification of soil C as per the United States department of agriculture textural classification chart is
Consider soil D:
Mark the percentage of sand for soil D as 50 %, percentage of silt as 15 %, and percentage of clay as 35 % in Figure (5.1) and mark the point of intersection of three lines.
Show the percentage of sand, silt, and clay of soil D as in Figure (4).
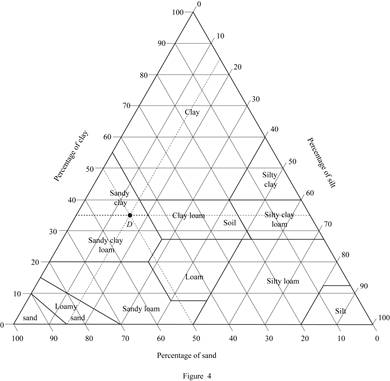
Refer Figure (4).
The classification of soil D as per the United States department of agriculture textural classification chart is
Consider soil E:
Mark the percentage of sand for soil E as 70 %, percentage of silt as 15 %, and percentage of clay as 15 % in Figure (5.1) and mark the point of intersection of three lines.
Show the percentage of sand, silt, and clay of soil E as in Figure (5).
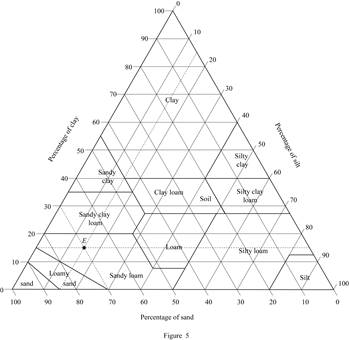
Refer Figure (5).
The classification of soil E as per the United States department of agriculture textural classification chart is
Consider soil F:
Refer Figure (5.1) “U.S. Department of agriculture textural classification (USDA)”
in the text book.
Mark the percentage of sand for soil F as 30 %, percentage of silt as 58 %, and percentage of clay as 12 % in Figure (5.1) and mark the point of intersection of three lines.
Show the percentage of sand, silt, and clay of soil F as in Figure (6).
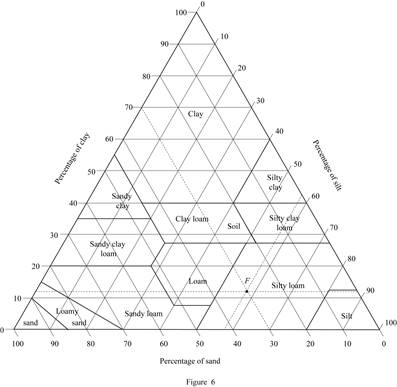
Refer Figure (6).
Hence, the classification of soil F as per the United States department of agriculture textural classification chart is
Consider soil G:
Mark the percentage of sand for soil G as 40 %, percentage of silt as 25 %, and percentage of clay as 35 % in Figure (5.1) and mark the point of intersection of three lines.
Show the percentage of sand, silt, and clay of soil G as in Figure (7).
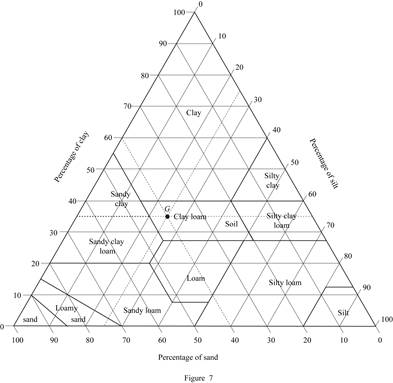
Refer Figure (7).
Thus, classification of soil G as per the United States department of agriculture textural classification chart is
Consider soil H:
Mark the percentage of sand for soil H as 30 %, percentage of silt as 25 %, and percentage of clay as 45 % in Figure (5.1) and mark the point of intersection of three lines.
Show the percentage of sand, silt, and clay of soil H as in Figure (8).
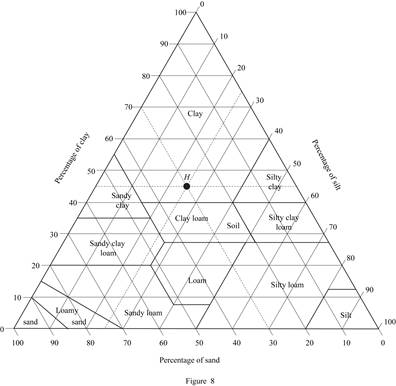
Refer Figure (8).
The classification of soil H as per the United States department of agriculture textural classification chart is
Consider soil I:
Mark the percentage of sand for soil I as 5 %, percentage of silt as 45 %, and percentage of clay as 50 % in Figure (5.1) and mark the point of intersection of three lines.
Show the percentage of sand, silt, and clay of soil I as in Figure (9).
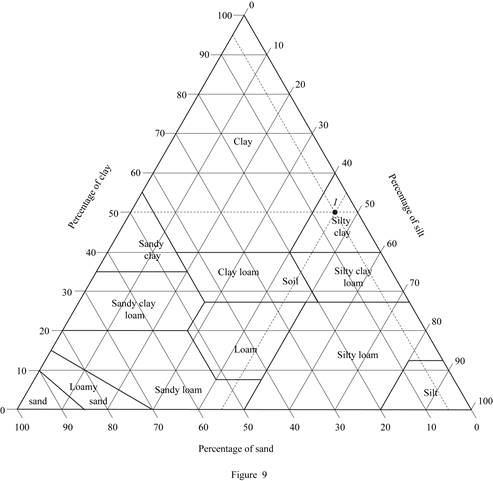
Refer Figure (9).
The classification of soil I as per the United States department of agriculture textural classification chart is
Consider soil J:
Mark the percentage of sand for soil J as 45 %, percentage of silt as 45 %, and percentage of clay as 10 % in Figure (5.1) and mark the point of intersection of three lines.
Show the percentage of sand, silt, and clay of soil J as in Figure (10).
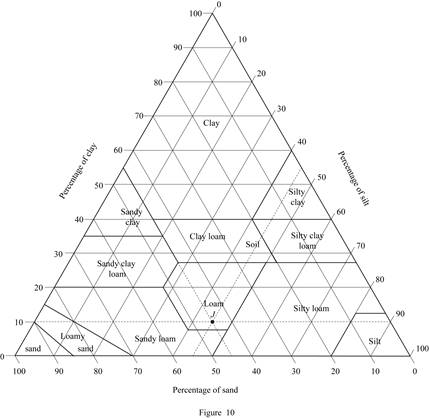
Refer Figure (10).
The classification of soil J as per the United States department of agriculture textural classification chart is
Want to see more full solutions like this?
Chapter 5 Solutions
Principles of Geotechnical Engineering (MindTap Course List)


- Question 7 Classify the following soil using the U.S. Department of Agriculture textural classification chart. Gravel - 10 Sand - 40 Silt - 25 Clay - 25 A) gravelly sandy loam B gravelly loam C) gravelly clay loam D gravelly silty loamarrow_forwardClassify the following soils by the AASHTO classification system. Give the group index for each soil.arrow_forwardDescribe Collapsible soils as one of the groupings of special soils.arrow_forward
- 1. Classify the following soils by using the USDA's textural classification chart. Soil Particle-size Distribution (%) A B C D E Gravel 0 0 10 20 15 Sand 25 5 20 40 32 Silt 65 7 35 22 25 Clay 10 88 30 18 28arrow_forwardClassify the two soils according to USDA Textural Classification.arrow_forwardDefine the major types of soils and their classification systems.arrow_forward
- Classify soils A, B, C, and D based on the USCS (ASTM D2487 – 17) indicating the symbol and soil description. Additionally, classify the soils according to the AASHTO Soil Classification System indicating the name of the soil group as well as the GI. Sieve Opening (mm) Percent Passing (%) Soil D Soil C Sieve Number Soil A Soil B No. 4 4.750 78 75 60 78 88 88 No. 10 2.000 75 75 75 No. 18 1.000 60 60 60 No. 30 0.600 45 45 45 45 No. 40 0.425 30 30 30 30 No. 60 0.250 22 22 22 22 No. 100 0.150 15 15 15 15 No. 140 0.105 10 10 10 14 No. 200 0.075 8. 4 13 LL 60 60 20 20 PL 25 35 14 14arrow_forwardClassify the soils (acronyms and full name) 1,4, 5 and 8 according to the U.S.C.S systemarrow_forwardQuestion 17 Classify the following soil using the U.S. Department of Agriculture textural classification chart. Sand - 10 Silt - 45 Clay - 45 A) silty clay loam clay (c) clay loam D silty clayarrow_forward
- Classify the following soils by using Unified Soil Classification System. Give the group symbols and the group names.arrow_forwardQuestion 13 Classify the following soil using the U.S. Department of Agriculture textural classification chart. Sand - 55 Silt - 5 Clay - 40 A) sandy clay loam B) silty clay c) clay D sandy clayarrow_forwardThe soil has the following particle-size distribution Gravel – 20%, Sand – 10%, Silt, 30%, Clay, 40%.Classify according to USDA textural classification system.arrow_forward

 Structural Analysis (10th Edition)Civil EngineeringISBN:9780134610672Author:Russell C. HibbelerPublisher:PEARSON
 Principles of Foundation Engineering (MindTap Cou...Civil EngineeringISBN:9781337705028Author:Braja M. Das, Nagaratnam SivakuganPublisher:Cengage Learning
 Fundamentals of Structural AnalysisCivil EngineeringISBN:9780073398006Author:Kenneth M. Leet Emeritus, Chia-Ming Uang, Joel LanningPublisher:McGraw-Hill Education
 Traffic and Highway EngineeringCivil EngineeringISBN:9781305156241Author:Garber, Nicholas J.Publisher:Cengage Learning