Concept explainers
Videos
Assume that you are sampling a trait in animal populations; the trait is controlled by a single allelic pair A and a, and you can distinguish all three
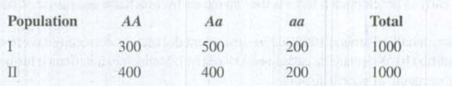
Calculate the distribution of phenotypes in each population as expected under Hardy-Weinberg equilibrium. Is population I in equilibrium? Is population II in equilibrium?
To determine: Whether Population I is in Hardy-Weinberg equilibrium.
Introduction: A population is in Hardy-Weinberg equilibrium where the allele and genotype frequencies remain constant over generations. Hardy-Weinberg equilibrium follows the given equation, p2 + 2pq + q2 = 1, where, p2 represents the dominant homozygous genotype, q2 represents the recessive homozygous genotype and 2pq represent the heterozygous genotype.
Explanation of Solution
The animal population has A is a dominant allele and a is a recessive allele.
| Genotype | Number of individuals | Frequency |
| AA | 300 | 300/1000=0.30 |
| Aa | 500 | 500/1000=0.50 |
| aa | 200 | 200/1000=0.20 |
| Total | 1000 |
Frequency of allele A
For a population in Hardy-Weinberg equilibrium
In this case
Putting the values in the above equation,
Distribution of population according to Hardy-Weinberg equilibrium is as follows:
| Genotype | The phenotypic ratio at Hardy-Weinberg equilibrium | Number of individuals (ratio x total number of the individual) |
| AA | 0.30 | 300 |
| Aa | 0.50 | 500 |
| aa | 0.20 | 200 |
| Total | 1 | 1000 |
Population I is at Hardy-Weinberg equilibrium as expected and the observed phenotype is the same.
To determine: Whether Population II is in Hardy-Weinberg equilibrium.
Explanation of Solution
The animal population has A is a dominant allele and a is a recessive allele.
| Genotype | Number of individuals | Frequency |
| AA | 400 | 400/1000=0.40 |
| Aa | 400 | 400/1000=0.40 |
| aa | 200 | 200/1000=0.20 |
| Total | 1000 |
Frequency of allele A
Frequency of allele a
For a population in Hardy-Weinberg equilibrium
In this case
Putting the values in the above equation,
Distribution of population according to Hardy-Weinberg equilibrium is as follows:
| Genotype | The phenotypic ratio at Hardy-Weinberg equilibrium | Number of individuals (ratio x total number of an individual) |
| AA | 0.36 | 160 |
| Aa | 0.48 | 480 |
| aa | 0.16 | 160 |
| Total | 1 | 1000 |
Population II is not at Hardy-Weinberg equilibrium as expected and the observed phenotype is not the same.
Want to see more full solutions like this?
Chapter 6 Solutions
Loose Leaf For Integrated Principles Of Zoology


- Assume that the frequency of gene B in a hypothetical population Is 0.63, that there are only two alleles (B and b) of the gee in the population, that allele B is dominant over allele b, that neither allele has a selective advantage over the other, and that the population is at equilibrium with regard to this particular gene. And how many individuals in this population are expected to be of genotype BB according to the Hardy-Weinberg formula? (Assume that the total population size is 150) 71 52 118 60 131arrow_forwardConsider a population of 2500 individuals at Hardy-Weinberg equilibrium. There are two loci, each with two alleles, in linkage equilibrium with one another. - At the first locus the alleles "A" and "e" cause two distinct phenotypes; individuals who are "AA" or "Ae" are Alabaster whereas individuals who are "ee" are ebony. -At the second locus the alleles "L" and "S" cause three distinct phenotypes. Individuals who are "LL" are large, individuals who are "LS" are medium and individuals who are "SS" are small. If we determine that there are 1029 alabaster large and 196 ebony large individuals: (a) What is the frequency of the "A" allele? Round to nearest 0.001. (b) How many copies of the "e" allele exist in the population? Round to nearest integer. (c) What proportion of the population are ebony medium individuals? Round to nearest 0.001. (d) How many individuals will be homozygous at both loci? Round to nearest integer. (e) If the environment suddenly changed and ebony individuals…arrow_forwardConsider the B locus which has two alleles in a population: B and b. Researchers examined the genotypes several individuals for this locus and obtained the following numbers B/B: 302individuals B/b: 56individuals b/b: 17individuals If the B locus is at Hardy-Weinberg equilibrium, what would the expected number of individuals with the Bb genotype? Round your answer to the closest full number.arrow_forward
- Consider an autosomal locus with alleles A and a. If the the allele frequencies are as follows Freq(A) = 0.4, Freq(a) = 0.6. , then what is the predicted frequency of heterozygous Aa individuals, assuming the population is in Hardy-Weinberg equilibrium? Freq(Aa) = ? Enter a number between 0 and 1, inclusive, for example 0.33arrow_forwardIn a population of 200 people, an allele F has a frequency of 84%. What is the frequency of allele f? Using the Hardy-Weinberg equation, estimate the numbers of homozygous dominant, heterozygous, and homozygous recessive genotypes. (Remember that the formula is: p2 + 2pq + q2 = 1, where p represents the dominant allele and q represents the recessive allele.) *Be sure to account for all 200 people in the population.arrow_forwardHow Can We Measure Allele Frequencies in Populations? What are four assumptions of the HardyWeinberg law?arrow_forward
- In smurfs, blue tails and red tails are codominant to white tails (this is similar to blood type in humans). In a population of 200 smurfs, 6 have white tails, 93 have blue tails, 51 have red tails, and 50 have purple tails. Papa smurf has learned that the frequency of the blue tail allele is 0.53. Is this population in Hardy-Weinberg Equilibrium? Be sure to do a Chi-square test and show your work.arrow_forwardIn a certain population of frogs, 120 are green, 60 are brownish green, and 20 are brown. The allele for brown is denoted GB, and the allele for green is designated GG. These two alleles are incompletely dominant to each other. If this population were in Hardy-Weinberg equilibrium, how many green frogs would you expect to observe? (Remember to multiply the expected frequency by the number of frogs in the population.)arrow_forwardThis lab exercise requires that we count certain Mendelian traits among students present in the lab. Your professor will explain each trait being addressed and will then ask students to identify if they are dominant or recessive for that specific trait. The collected traits will then be plugged into the Hardy-Weinberg Equilibrium formula in order to calculate frequency of Homozygous dominant, Heterozygous and Homozygous recessive individuals in the same. p2 + 2pq + q2 = 100 given data: trait: hair swirl 19 individuals total. 10 had the homozygous dominant hair swirl trait: clockwise the nine other were recessive please do a step by step explanation with the calculation using this data, as I am very unfamiliar with what values mean what and the equation itself thank you!arrow_forward
- In corn, kernel color is governed by a dominant allele for white color (W) and by a recessive allele for yellow (w). A random sample of 152 kernels from a population that is in Hardy- Weinberg equilibrium reveals that 35 kernels are yellow and 117 kernels are white. What is the frequency of individuals with the homozygous dominant genotype?arrow_forwardEye color in a species of fruitfly is determined by a single locus with two alleles: E and e. EE individuals have red eyes, Ee have pink eyes, and ee individuals have brown eyes. In a lab population that is in Hardy- Weinberg equilibrium, we count 34 flies with brown eyes out of 144. How many flies can you expect to have red eyes? Round your answer to the closest integer value.arrow_forwardThe Rh factor is an antigen expressed on red blood cells and is controlled by a single gene. The dominant allele RH causes a person to be Rh, positive, and the recessive allele is represented as rh. Assume that a population is in Hardy-Weinberg equilibrium and 16 individuals out of 100 are Rh negative. What are the allele frequencies of RH and rh in this population? A. The allele frequency of RH is 0.80 and the allele frequency of rh is 0.20 B. The allele frequency of RH is 0.84 and the allele frequency of rh is 0.16 C. The allele frequency of RH is 0.50 and the allele frequency of rh is 0.50 D. The allele frequency of RH is 0.60 and the allele frequency of rh is 0.40arrow_forward
 Human Heredity: Principles and Issues (MindTap Co...BiologyISBN:9781305251052Author:Michael CummingsPublisher:Cengage Learning