
Videos
Since laboratory or field experiments are generally expensive and time consuming,
- a. Use the Osman et al. (2008) method [Eqs. (6.15) through (6.18)].
- b. Use the Gurtug and Sridharan (2004) method [Eqs. (6.13) and (6.14)].
- c. Use the Matteo et al. (2009) method [Eqs. (6.19) and (6.20)].
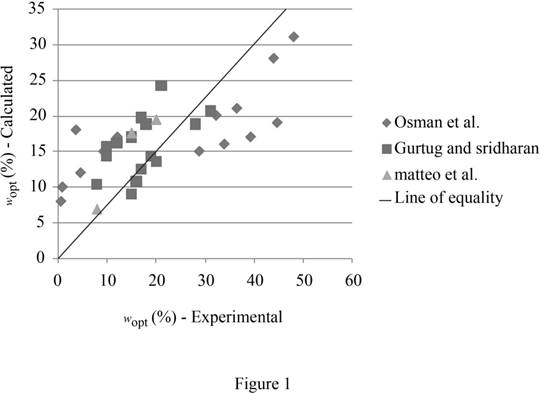
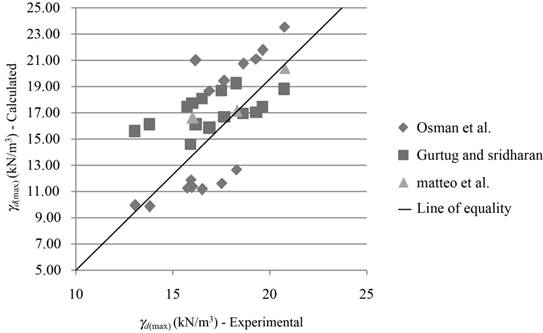
- d. Plot the calculated wopt against the experimental wopt, and the calculated γd(max) with the experimental γd(max). Draw a 45° line of equality on each plot.
- e. Comment on the predictive capabilities of various methods. What can you say about the inherent nature of empirical models?
(a)
Find the optimum moisture content and maximum dry unit weight using Osman et al. (2008) method.
Explanation of Solution
Calculation:
Determine the plasticity index PI using the relation.
Here, LL is the liquid limit for soil 1 and PL is the plastic limit for soil 1.
Substitute 17 % for LL and 16 % for PL.
Similarly, calculate the PI for remaining soils.
Determine the optimum moisture content for soil 1 using the relation.
Here, E is the compaction energy for soil 1.
Substitute
Similarly, calculate the optimum moisture content for remaining soils.
Determine the value of L using the relation.
Substitute
Determine the value of M using the relation.
Substitute
Determine the maximum dry unit weight of the soil 1 using the relation.
Substitute 23.78 for L, 0.387 for M, and 0.69 % for
Similarly, calculate the maximum dry unit weight for remaining soils.
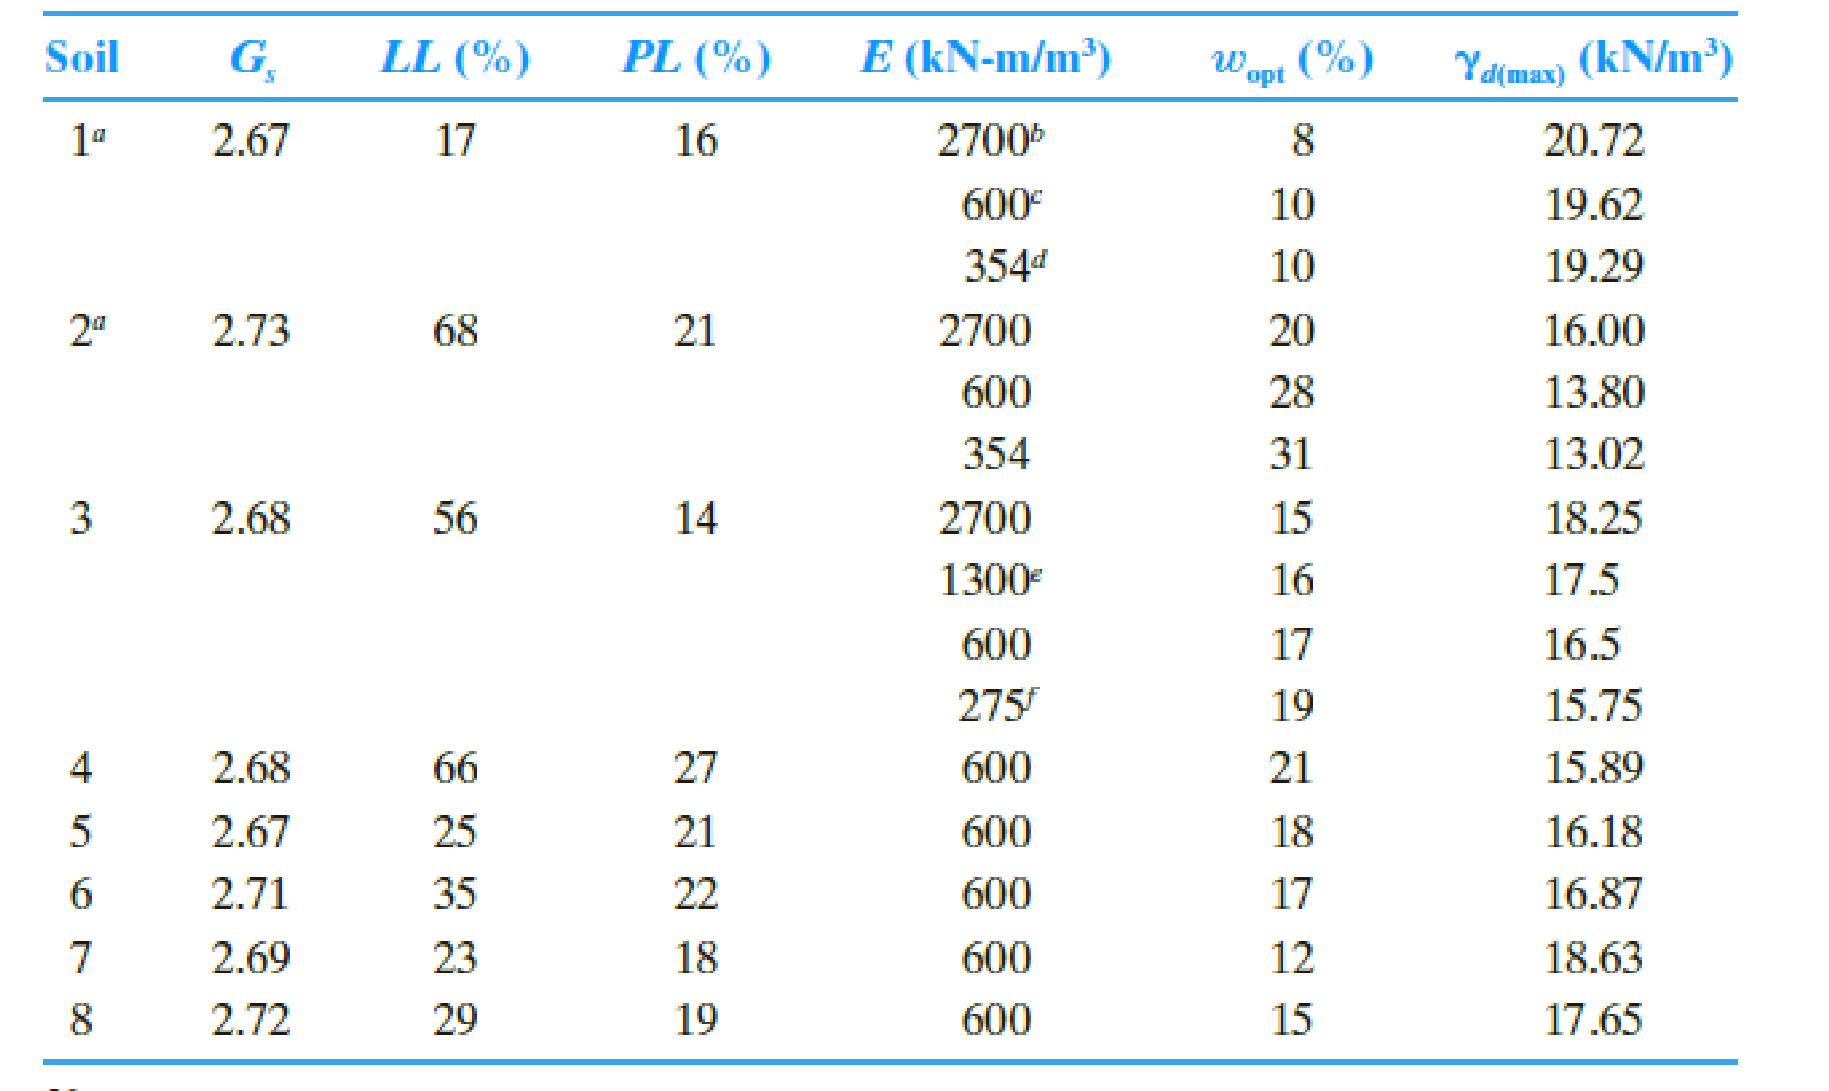
Summarize the calculated values as in Table 1.
| Soil |
LL (%) |
PL (%) |
PI (%) |
E |
(Exp) |
(Exp) |
| L | M |
|
| 1 | 17 | 16 | 1 | 2,700 | 8 | 20.72 | 0.69 | 23.782 | 0.387 | 23.51 |
| 600 | 10 | 19.62 | 0.93 | 21.984 | 0.277 | 21.73 | ||||
| 354 | 10 | 19.29 | 1.02 | 21.354 | 0.238 | 21.11 | ||||
| 2 | 68 | 21 | 47 | 2,700 | 20 | 16.00 | 32.26 | 23.782 | 0.387 | 11.30 |
| 600 | 28 | 13.80 | 43.92 | 21.984 | 0.277 | 9.82 | ||||
| 354 | 31 | 13.02 | 48.01 | 21.354 | 0.238 | 9.91 | ||||
| 3 | 56 | 14 | 42 | 2,700 | 15 | 18.25 | 28.82 | 23.782 | 0.387 | 12.63 |
| 1,300 | 16 | 17.50 | 33.89 | 22.908 | 0.333 | 11.61 | ||||
| 600 | 17 | 16.50 | 39.24 | 21.984 | 0.277 | 11.12 | ||||
| 275 | 19 | 15.75 | 44.65 | 21.052 | 0.220 | 11.23 | ||||
| 4 | 66 | 27 | 39 | 600 | 21 | 15.89 | 36.45 | 21.984 | 0.277 | 11.89 |
| 5 | 25 | 21 | 4 | 600 | 18 | 16.18 | 3.740 | 21.984 | 0.277 | 20.95 |
| 6 | 35 | 22 | 13 | 600 | 17 | 16.87 | 12.15 | 21.984 | 0.277 | 18.62 |
| 7 | 23 | 18 | 5 | 600 | 12 | 18.63 | 4.67 | 21.984 | 0.277 | 20.69 |
| 8 | 29 | 19 | 10 | 600 | 15 | 17.65 | 9.35 | 21.984 | 0.277 | 19.39 |
(b)
Find the optimum moisture content and maximum dry unit weight using Gurtug and Sridharan (2004) method.
Explanation of Solution
Calculation:
Determine the optimum moisture content for soil 1 using the relation.
Substitute
Determine the maximum dry unit weight of the soil 1 using the relation.
Substitute 10.34 % for
Similarly, calculate the maximum dry unit weight for remaining soils.
Summarize the calculated values as in Table 2.
| Soil |
PL (%) |
E |
(Exp) |
(Exp) |
|
|
| 1 | 16 | 2,700 | 8 | 20.72 | 10.34 | 18.77 |
| 600 | 10 | 19.62 | 14.31 | 17.46 | ||
| 354 | 10 | 19.29 | 15.70 | 17.02 | ||
| 2 | 21 | 2,700 | 20 | 16.00 | 13.57 | 17.69 |
| 600 | 28 | 13.80 | 18.78 | 16.08 | ||
| 354 | 31 | 13.02 | 20.61 | 15.55 | ||
| 3 | 14 | 2,700 | 15 | 18.25 | 9.05 | 19.22 |
| 1,300 | 16 | 17.50 | 10.73 | 18.64 | ||
| 600 | 17 | 16.50 | 12.52 | 18.04 | ||
| 275 | 19 | 15.75 | 14.32 | 17.45 | ||
| 4 | 27 | 600 | 21 | 15.89 | 24.15 | 14.58 |
| 5 | 21 | 600 | 18 | 16.18 | 18.78 | 16.08 |
| 6 | 22 | 600 | 17 | 16.87 | 19.67 | 15.82 |
| 7 | 18 | 600 | 12 | 18.63 | 16.10 | 16.89 |
| 8 | 19 | 600 | 15 | 17.65 | 16.99 | 16.62 |
(c)
Find the optimum moisture content and maximum dry unit weight using Matteo et al. method.
Explanation of Solution
Calculation:
Determine the optimum moisture content for soil 1 using the relation.
Substitute 17 % LL and
Determine the maximum dry unit weight of the soil 1 using the relation.
Substitute 6.94 % for
Similarly, calculate the maximum dry unit weight for remaining soils.
Summarize the calculated values as in Table 3.
| Soil |
Specific gravity |
PI (%) |
(Exp) |
(Exp) |
|
|
| 1 | 2.67 | 1 | 8 | 20.72 | 6.94 | 20.37 |
| 10 | 19.62 | 6.94 | 20.37 | |||
| 10 | 19.29 | 6.94 | 20.37 | |||
| 2 | 2.73 | 47 | 20 | 16.00 | 19.44 | 16.60 |
| 28 | 13.80 | 19.44 | 16.60 | |||
| 31 | 13.02 | 19.44 | 16.60 | |||
| 3 | 2.68 | 42 | 15 | 18.25 | 17.56 | 17.11 |
| 16 | 17.50 | 17.56 | 17.11 | |||
| 17 | 16.50 | 17.56 | 17.11 | |||
| 19 | 15.75 | 17.56 | 17.11 | |||
| 4 | 2.68 | 39 | 21 | 15.89 | 20.31 | 16.25 |
| 5 | 2.67 | 4 | 18 | 16.18 | 9.16 | 19.52 |
| 6 | 2.71 | 13 | 17 | 16.87 | 11.36 | 18.97 |
| 7 | 2.69 | 5 | 12 | 18.63 | 8.41 | 20.25 |
| 8 | 2.72 | 10 | 15 | 17.65 | 9.67 | 19.82 |
(d)
Plot the graph between the calculated
Explanation of Solution
Refer Table 1, 2, and 3.
Draw the graph between the calculated
Draw the graph between calculated
(e)
Comment on the predictive capabilities of various methods and comment about the inherent nature of empirical models.
Explanation of Solution
Prediction of optimum moisture content:
Refer Figure (1), several data points are closely packed around the
Prediction of maximum dry unit weight:
Most data points for all models show good covenant between the calculated and the experimental values.
The empirical models are often limited to the materials, test methods and environmental conditions under which the experiments were conducted and the developed models. For new materials and conditions, the predicted values may not be reliable.
Want to see more full solutions like this?
Chapter 6 Solutions
Principles of Geotechnical Engineering (MindTap Course List)


- Geotechnical laboratory tests were conducted to determine the liquid limit of soils. The data set shown in Table1 was obtained by using Casagrande's apparatus on Soil A (Plastic Limit = 32). The data set shown in Table 2was obtained by using Cone penetrometer on a different Soil B (Plastic Limit = 28).Table 1. Data from LL cup testing Table 2. Data from Cone penetrometer(a) Draw the Flow curve for soil A and B.(b) Calculate the Flow Index for both soils.(c) Calculate the Liquid limit for both soils.(d) Calculate the Plasticity and the Liquidity Indices for both soils, if both soils were found to havethe same current water content of 30%.(e) What can be said about the strengths of the soils in their current state?arrow_forwardConsidering broad categories of soil types and commonly used soil sampling tools, please answer the following questions. What type of sampler is used to sample granular soils for Thin-walled or Shelby tube sampler → laboratory testing? What type of sampler is used to sample cohesive soils for Choose... laboratory testing? v Choose... Thin-walled or Shelby tube sampler Split-barrel or split- Split-spoon samples are undisturbed and good for shear strer spoon sampler on testing. Electric cone penetrometerarrow_forwardFALLING HEAD PERMEABILITY TEST OTHER QUESTIONS: 1. What is the importance of finding the coefficient of permeability of soils? 2. What is the difference between constant head permeability test and falling head permeability test? 3. Why is it needed to fully saturate the soil first before conducting the experiment? 4. Why is there a need to remove air bubbles from the specimen?arrow_forward
- Let us assume that a soil sample taken in the field is taken and it must be identified by the SUCS Method and AASHTO Method. Moisture content = 5.75% Limit liquid = 53.5 Plastic limit = 31.6 Granulometry Sieve % Pass No. 4 100 # 40 68 # 200 54.3 Do you select the best answer? a) Inorganic silt and sand, with low plasticity b) Inorganic clay with low plasticity c) Clay silt, traces of gravel, dark Brownarrow_forwardThe permeability test must be carried out on a soil sample 15 cm long and 8 cm in diameter using the permeameter illustrated below. What is the difference between a variable head permeameter and a constant head permeameter?What is the disadvantage of using the constant head permeameter for all soil types? Which pemeameter is it in the illustration below? Justify your answer.How to calculate the permeability coefficient when the pressure drop is maintained at 30 cm and it takes 2 min and 35 s to collect a volume of water of 200 ml? Is it possible to identify the soil from this result? If so, what soil is it?arrow_forwardConsidering broad categories of soil types and commonly used soil sampling tools, please answer the following questions. What type of sampler is used to sample granular soils for Choose... laboratory testing? What type of sampler is used to sample cohesive soils for v Choose... laboratory testing? Thin-walled or Shelby tube sampler Split-barrel or split- spoon sampler Electric cone Split-spoon tesing er penetrometer onarrow_forward
- Soil Compaction 3. Determine the ff: Lab-compaction curve and determine the MDD and OMC (show complete solution) Determine the range of moisture content corresponding to at least 95% relative 1. compaction. Determine the dry density of compaction in the field (Mg/m³) and degree of compaction in the field. If the compaction specifications require relative compaction in the field at least 95% and moisture content within 3% of the Optimum Laboratory Value, are the specifications met? (if not, which specification is not met) 3. 4.arrow_forwardA soil sample has the following size distribution; 4 to 2mm = 17%, 2 to 0.05 mm = 12%, 0.5 to 0.005 mm = 22% 0.005 to 0.002 mm = 10% <0.002 mm = 39% what are the percentages of clay, silt, and sand? Using USDA calssification what is the modifier and tetural classificationarrow_forwardFUNDAMENTALS OF GEOTECHNICAL ANALYSIS A constant head permeability test is performed on soil that is 2 cm x 2 cm square, and 2.5cm long. The head difference applied during the test is 20 cm and 7 cm3 is collected over a time of 100 sec. Provide step by step solution. a) Compute the permeability based on these test conditions and results. b) A falling head test is conducted on the same soil specimen at the same time (t1 – t2 = 100 sec), and the standpipe diameter is 0.8 cm. If the average head during the test should be 18 cm, what are h1 and h2 values?arrow_forward
- 1. Two soil samples A and B were found to have the physical properties shown in Table 1. Check the statement (true or false): void ratio of sample A is greater than void ratio of sample B. Show, using a phase diagram, the process by which you have arrived at your answer. Table 1. Results of physical properties. Sample A 15 2.75 50 Physical Properties Moisture content, w (%) Specific gravity of solids, Gs Degree of saturation, St (%) Sample B 6 2.68 30arrow_forwardMake necessary calculations to see if the control tests meets the specifications. For a given soil, following After compaction of soil in the field, sand cone tests (control tests) were conducted at five are the results of compaction tests conducted in the laboratory: separate locations. Following are the results: Moisture Moist Unit Location Moisture Dry Unit Content, % Weight, kg/m Content, % Weight, kN/m³ 1 15.2 2055 1 16.4 2060 12 16.34 3 17.2 1971 14 16.93 4 18.8 1980 16 17.24 21.1 2104 18 17.20 The specifications require that: a. Ya must be at least 0.95%d (max) b. Moisture content, w, should be within 2% of Wopt 20 16.75 22 16.23arrow_forwardYou are given the following results from Atterberg Limit testing on a soil sample (PL = 20%, LL = 58%) collected from a boring on a local project site. What is the USCS group symbol for this soil? (Refer Fig. B and USCS) e.g OL PLASTICITY INDEX (PI) 60 50 40 30 20 10 0 CASAGRANDE CHART For classification of fine-grained soils and fine-grained fraction of coarse grained soils. 10 CL or OL 20 "/wis. PLASS -LINE: POSLL-8) ML or OL 30 40 50 GO LIQUID LIMIT (LL) A-LINE PITALL-20) CH or OH Figure B: Atterberg chart MH or OH 70 80 Comple Sample 2 90 100arrow_forward
 Principles of Geotechnical Engineering (MindTap C...Civil EngineeringISBN:9781305970939Author:Braja M. Das, Khaled SobhanPublisher:Cengage Learning