A marathon is a fool race with a distance of 26.22 miles. It was one of the original events of the modem Olympics, where it was a men’s only event. The women’s marathon became an Olympic event in 1984. The Olympic record for the men’s marathon was set during the 2008 Olympics by Samuel Kamau Wanjiru of Kenya, with a time of 2 hours, 6 minutes, 32 seconds. The Olympic record for the women’s marathon was set during the 2012 Olympics by Tiki Gelana of Ethiopa, with a time of 2 hours. 23 minutes, 7 seconds. Training for a marathon typically lasts at least 6 months. The training is gradual, with increases in distance about every 2 weeks. About 1 to 3 weeks before the race, the distance run is decreased slightly. The stem-and-leaf plots below show the marathon training times (in minutes) for a random sample of 30 male runners and 30 female runners. 6. A trainer wants to estimate the population mean running times for both male and female runners within 2 minutes. Determine the minimum sample size required to construct a 99% confidence interval for the population mean training time of (a) male runners. Assume the population standard deviation is 8.9 minutes. (b) female runners. Assume the population standard deviation is 8.4 minutes.
A marathon is a fool race with a distance of 26.22 miles. It was one of the original events of the modem Olympics, where it was a men’s only event. The women’s marathon became an Olympic event in 1984. The Olympic record for the men’s marathon was set during the 2008 Olympics by Samuel Kamau Wanjiru of Kenya, with a time of 2 hours, 6 minutes, 32 seconds. The Olympic record for the women’s marathon was set during the 2012 Olympics by Tiki Gelana of Ethiopa, with a time of 2 hours. 23 minutes, 7 seconds. Training for a marathon typically lasts at least 6 months. The training is gradual, with increases in distance about every 2 weeks. About 1 to 3 weeks before the race, the distance run is decreased slightly. The stem-and-leaf plots below show the marathon training times (in minutes) for a random sample of 30 male runners and 30 female runners. 6. A trainer wants to estimate the population mean running times for both male and female runners within 2 minutes. Determine the minimum sample size required to construct a 99% confidence interval for the population mean training time of (a) male runners. Assume the population standard deviation is 8.9 minutes. (b) female runners. Assume the population standard deviation is 8.4 minutes.
Solution Summary: The minimum sample size n needed to estimate mu is 132.
A marathon is a fool race with a distance of 26.22 miles. It was one of the original events of the modem Olympics, where it was a men’s only event. The women’s marathon became an Olympic event in 1984. The Olympic record for the men’s marathon was set during the 2008 Olympics by Samuel Kamau Wanjiru of Kenya, with a time of 2 hours, 6 minutes, 32 seconds. The Olympic record for the women’s marathon was set during the 2012 Olympics by Tiki Gelana of Ethiopa, with a time of 2 hours. 23 minutes, 7 seconds.
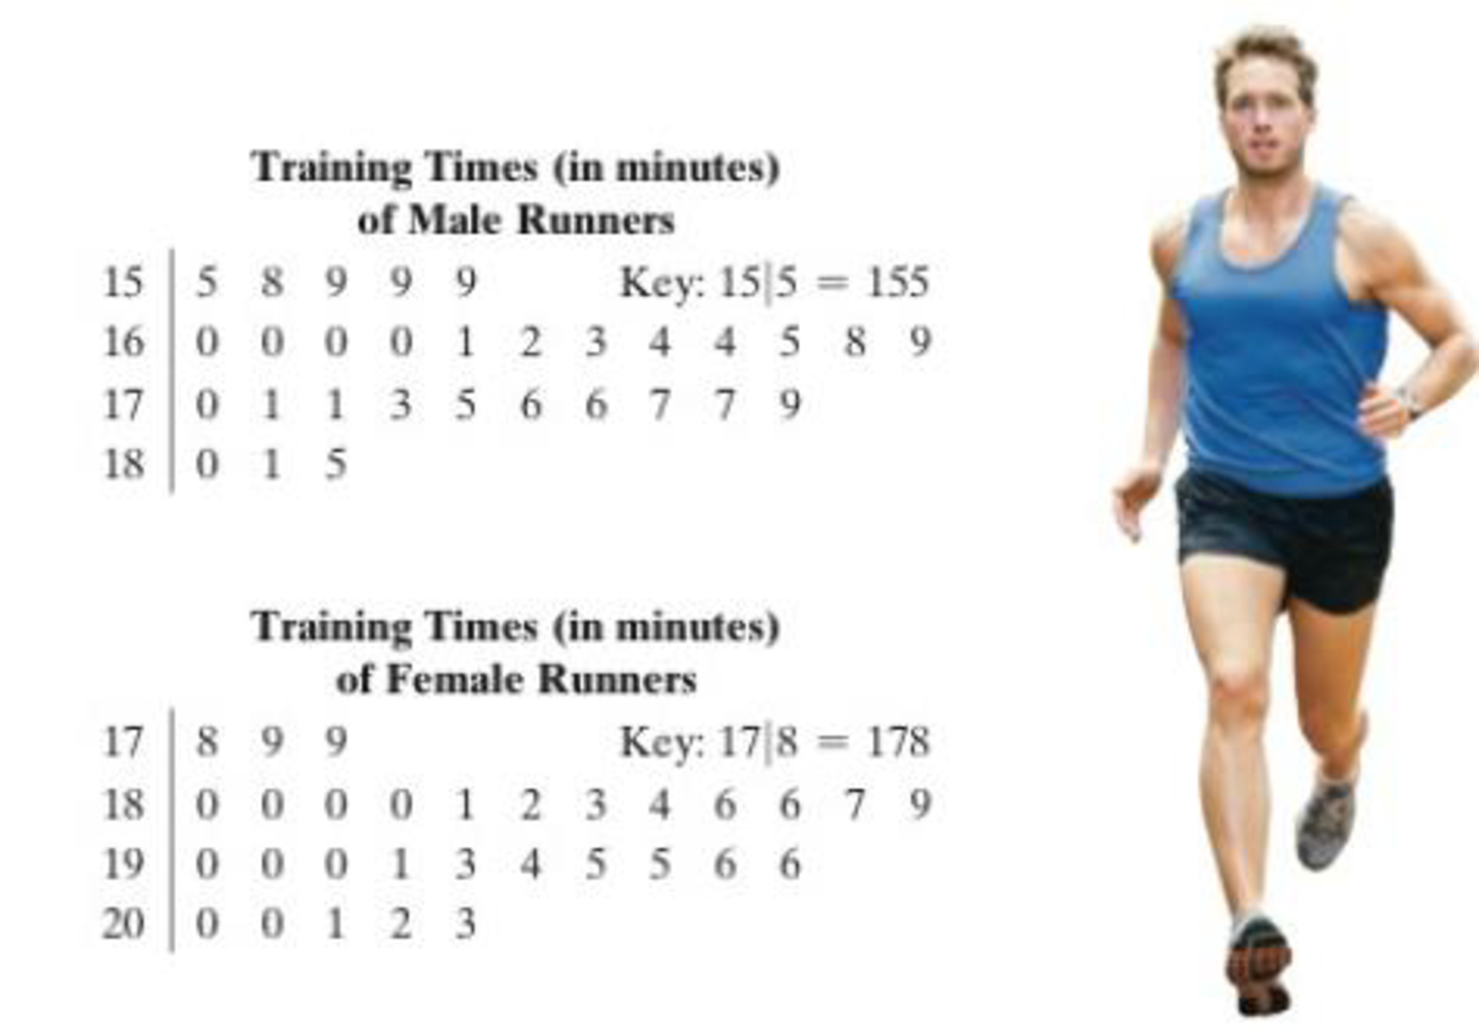
Training for a marathon typically lasts at least 6 months. The training is gradual, with increases in distance about every 2 weeks. About 1 to 3 weeks before the race, the distance run is decreased slightly. The stem-and-leaf plots below show the marathon training times (in minutes) for a random sample of 30 male runners and 30 female runners.
6. A trainer wants to estimate the population mean running times for both male and female runners within 2 minutes. Determine the minimum sample size required to construct a 99% confidence interval for the population mean training time of
(a) male runners. Assume the population standard deviation is 8.9 minutes.
(b) female runners. Assume the population standard deviation is 8.4 minutes.
Features Features Normal distribution is characterized by two parameters, mean (µ) and standard deviation (σ). When graphed, the mean represents the center of the bell curve and the graph is perfectly symmetric about the center. The mean, median, and mode are all equal for a normal distribution. The standard deviation measures the data's spread from the center. The higher the standard deviation, the more the data is spread out and the flatter the bell curve looks. Variance is another commonly used measure of the spread of the distribution and is equal to the square of the standard deviation.
Need a deep-dive on the concept behind this application? Look no further. Learn more about this topic, statistics and related others by exploring similar questions and additional content below.
Compound Interest Formula Explained, Investment, Monthly & Continuously, Word Problems, Algebra; Author: The Organic Chemistry Tutor;https://www.youtube.com/watch?v=P182Abv3fOk;License: Standard YouTube License, CC-BY
Applications of Algebra (Digit, Age, Work, Clock, Mixture and Rate Problems); Author: EngineerProf PH;https://www.youtube.com/watch?v=Y8aJ_wYCS2g;License: Standard YouTube License, CC-BY


 Algebra: Structure And Method, Book 1AlgebraISBN:9780395977224Author:Richard G. Brown, Mary P. Dolciani, Robert H. Sorgenfrey, William L. ColePublisher:McDougal Littell
 Elementary AlgebraAlgebraISBN:9780998625713Author:Lynn Marecek, MaryAnne Anthony-SmithPublisher:OpenStax - Rice University
 College Algebra (MindTap Course List)AlgebraISBN:9781305652231Author:R. David Gustafson, Jeff HughesPublisher:Cengage Learning