Understandable Statistics: Concepts and Methods
12th Edition
ISBN: 9781337119917
Author: Charles Henry Brase, Corrinne Pellillo Brase
Publisher: Cengage Learning
bartleby

Concept explainers

bartleby

Videos

Question
Book Icon
Chapter 6.6, Problem 13P

(a)

To determine

Find the probability that more than 180 take your free sample.

(a)

Expert Solution
Check Mark

Answer to Problem 13P

The probability that more than 180 take your free sample is 0.8669.

Explanation of Solution

Calculation:

Conditions for normal approximation to the binomial:

For a binomial experiment with n number of trails, r number of success, probability of success for each trail p and probability of failure q=1p, the r has binomial distribution which is approximated to a normal distribution if,

  • np>5
  • nq>5

Mean:

The mean formula for the binomial distribution using normal approximation is,

μ=np

In the formula n denotes number of trails, and p denotes probability of success.

Standard deviation:

The standard deviation formula for the binomial distribution using normal approximation is,

σ=npq

In the formula q=1p, n denotes number of trails, and p denotes probability of success.

Conditions for Continuity correction:

The continuity correction is used for converting the discrete random variable r denoting the number of success to continuous normal random variable x,

  • The value x is obtained by subtracting 0.5 from r when r is the left point for an interval. That is, x=r0.5.
  • The value x is obtained by adding 0.5 from r when r is the right point for an interval. That is, x=r+0.5.

Z score:

The number of standard deviations the original measurement x is from the value of mean μ is measured using the z-score or z value. The formula for z score is,

z=xμσ

In the formula, x is the raw score, μ is the mean and σ is the standard deviation.

Let r denotes the number of customers would take free samples.

The day you are offering free samples, 317 customers pass by your counter. That is, n=317, 60% of all customers will take free samples, That is, p=0.60, and the about 37% would buy what they have sampled given that those who take the free samples. That is, P(Buy|Sampled)=0.37.

Checking conditions:

np=317(0.60)=190.2>5

nq=n(1p)=317(10.60)=317(0.40)=126.8>5

It can be observed that two of the conditions np>5, nq>5 are satisfied by the binomial experiment. It is appropriate to use normal approximation to the binomial.

The mean is,

μ=np=317(0.60)=190.2

The standard deviation is,

σ=npq=317(0.60)(10.60)=76.08=8.7224

The probability that more than 180 take your free sample is,

P(r>180)=P(r181)P(x1810.5)=P(x180.5)

Step by step procedure to obtain standard normal curve using MINITAB software is given below:

  • Choose Graph > Probability Distribution Plot choose View Probability > OK.
  • From Distribution, choose ‘Normal’ distribution.
  • Enter the Mean as 190.2, and Standard deviation as 8.7224.
  • Click the Shaded Area tab.
  • Choose X Value and Right tail, for the region of the curve to shade.
  • Enter the X value as 180.5.
  • Click OK.

Output using MINITAB software is given below:

Understandable Statistics: Concepts and Methods, Chapter 6.6, Problem 13P , additional homework tip  1

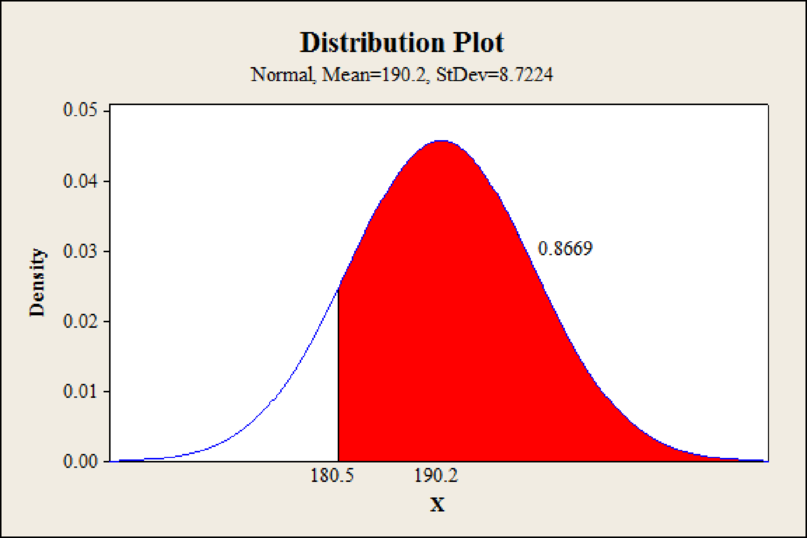
From Minitab output, the probability is 0.8669.

Hence, the probability that more than 180 take your free sample is 0.8669.

(b)

To determine

Find the probability that fewer than 200 take your free sample.

(b)

Expert Solution
Check Mark

Answer to Problem 13P

The probability that fewer than 200 take your free sample is 0.8568.

Explanation of Solution

Calculation:

The probability that fewer than 200 take your free sample is,

P(r<200)=P(r199)P(x199+0.5)=P(x199.5)

Step by step procedure to obtain standard normal curve using MINITAB software is given below:

  • Choose Graph > Probability Distribution Plot choose View Probability > OK.
  • From Distribution, choose ‘Normal’ distribution.
  • Enter the Mean as 190.2, and Standard deviation as 8.7224.
  • Click the Shaded Area tab.
  • Choose X Value and Left tail, for the region of the curve to shade.
  • Enter the X value as 199.5.
  • Click OK.

Output using MINITAB software is given below:

Understandable Statistics: Concepts and Methods, Chapter 6.6, Problem 13P , additional homework tip  2

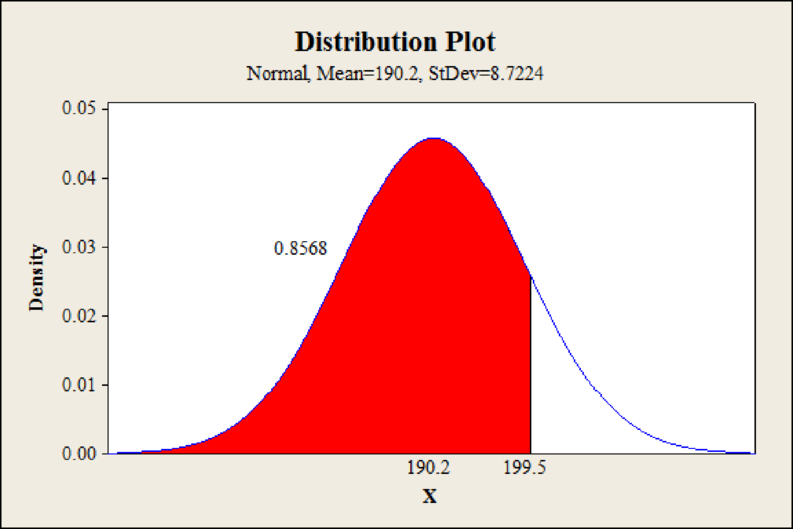
From Minitab output, the probability is 0.8568.

Hence, the probability that fewer than 200 take your free sample is 0.8568.

(c)

To determine

Find the probability that a customer takes a free sample and buys the product.

(c)

Expert Solution
Check Mark

Answer to Problem 13P

The probability that a customer takes a free sample and buys the product is 0.222.

Explanation of Solution

Calculation:

Conditional probability:

The conditional probability formula is,

P(A|B)=P(A and B)P(B)

The probability that a customer takes a free sample and buys the product is,

P(Buy and Sampled)=P(Sampled)×P(Buy|Sampled)=0.60×0.37=0.222

Hence, the probability that a customer takes a free sample and buys the product is 0.222.

(d)

To determine

Find the probability that between 60 and 80 customers would take the free sample and buy the product.

(d)

Expert Solution
Check Mark

Answer to Problem 13P

The probability that between 60 and 80 customers would take the free sample and buy the product is 0.8436.

Explanation of Solution

Calculation:

Let r denotes the number of customer takes a free sample and buys the product.

The day you are offering free samples, 317 customers pass by your counter. That is, n=317, and the probability of success for each trail is p=0.222.

Checking conditions:

np=317(0.222)=70.374>5

nq=n(1p)=317(10.222)=317(0.778)=246.626>5

It can be observed that two of the conditions np>5, nq>5 are satisfied by the binomial experiment. It is appropriate to use normal approximation to the binomial.

The mean is,

μ=np=317(0.222)=70.374

The standard deviation is,

σ=npq=317(0.222)(10.222)=54.750972=7.3994

The probability that between 60 and 80 customers would take the free sample and buy the product is,

P(60r80)P(600.5r80+0.5)=P(59.5x80.5)

Step by step procedure to obtain standard normal curve using MINITAB software is given below:

  • Choose Graph > Probability Distribution Plot choose View Probability > OK.
  • From Distribution, choose ‘Normal’ distribution.
  • Enter the Mean as 70.374, and Standard deviation as 7.3994.
  • Click the Shaded Area tab.
  • Choose X Value and Middle, for the region of the curve to shade.
  • Enter the X value 1 as 59.5, the X value 2 as 80.5.
  • Click OK.

Output using MINITAB software is given below:

Understandable Statistics: Concepts and Methods, Chapter 6.6, Problem 13P , additional homework tip  3

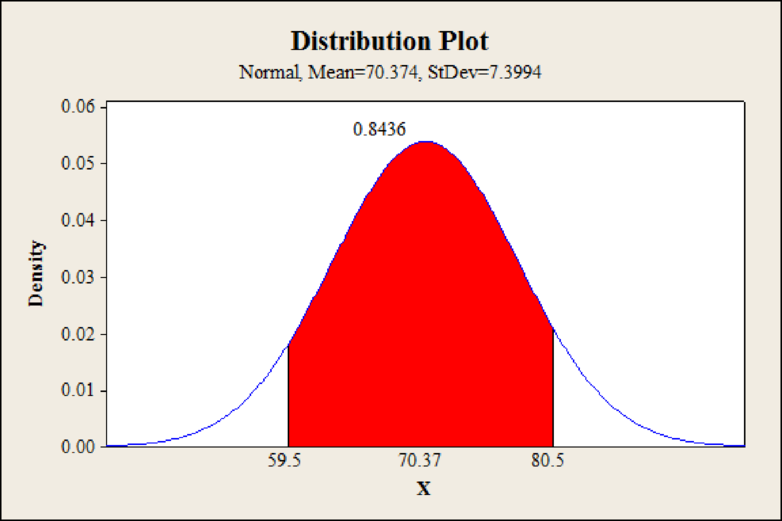
From Minitab output, the probability is 0.8436.

Hence, the probability that between 60 and 80 customers would take the free sample and buy the product is 0.8436.

Want to see more full solutions like this?

Subscribe now to access step-by-step solutions to millions of textbook problems written by subject matter experts!

Chapter 6 Solutions

Understandable Statistics: Concepts and Methods

Ch. 6.1 - Pain Management: Laser Therapy Effect of...Ch. 6.1 - Control Charts: Yellowstone National Park...Ch. 6.1 - Control Charts: Bank Loans Tri-County Bank is a...Ch. 6.1 - Control Charts: Motel Rooms The manager of Motel...Ch. 6.1 - Prob. 15PCh. 6.1 - Prob. 16PCh. 6.1 - Uniform Distribution: Measurement Errors...Ch. 6.1 - Prob. 18PCh. 6.1 - Prob. 19PCh. 6.1 - Prob. 20PCh. 6.2 - Statistical Literacy What does a standard score...Ch. 6.2 - Statistical Literacy Does a raw score less than...Ch. 6.2 - Prob. 3PCh. 6.2 - Prob. 4PCh. 6.2 - Basic Computation: z Score and Raw Score A normal...Ch. 6.2 - Basic Computation: z Score and Raw Score A normal...Ch. 6.2 - Prob. 7PCh. 6.2 - Prob. 8PCh. 6.2 - z Scores: First Aid Course The college physical...Ch. 6.2 - Prob. 10PCh. 6.2 - Prob. 11PCh. 6.2 - Normal Curve: Tree Rings Tree-ring dates were used...Ch. 6.2 - Basic Computation: Finding Areas Under the...Ch. 6.2 - Prob. 14PCh. 6.2 - Basic Computation: Finding Areas Under the...Ch. 6.2 - Prob. 16PCh. 6.2 - Prob. 17PCh. 6.2 - Prob. 18PCh. 6.2 - Prob. 19PCh. 6.2 - Basic Computation: Finding Areas Under the...Ch. 6.2 - Prob. 21PCh. 6.2 - Prob. 22PCh. 6.2 - Prob. 23PCh. 6.2 - Prob. 24PCh. 6.2 - Prob. 25PCh. 6.2 - Prob. 26PCh. 6.2 - Prob. 27PCh. 6.2 - Prob. 28PCh. 6.2 - Prob. 29PCh. 6.2 - Basic Computation: Finding Areas Under the...Ch. 6.2 - Prob. 31PCh. 6.2 - Prob. 32PCh. 6.2 - Basic Computation: Finding Probabilities In...Ch. 6.2 - Prob. 34PCh. 6.2 - Prob. 35PCh. 6.2 - Prob. 36PCh. 6.2 - Prob. 37PCh. 6.2 - Basic Computation: Finding Probabilities In...Ch. 6.2 - Prob. 39PCh. 6.2 - Prob. 40PCh. 6.2 - Prob. 41PCh. 6.2 - Prob. 42PCh. 6.2 - Basic Computation: Finding Probabilities In...Ch. 6.2 - Prob. 44PCh. 6.2 - Basic Computation: Finding Probabilities In...Ch. 6.2 - Prob. 46PCh. 6.2 - Prob. 47PCh. 6.2 - Basic Computation: Finding Probabilities In...Ch. 6.2 - Prob. 49PCh. 6.2 - Prob. 50PCh. 6.3 - Statistical Literacy Consider a normal...Ch. 6.3 - Statistical Literacy Suppose 5% of the area under...Ch. 6.3 - Prob. 3PCh. 6.3 - Critical Thinking: Normality Consider the...Ch. 6.3 - Basic Computation: Find Probabilities In Problems...Ch. 6.3 - Basic Computation: Find Probabilities In Problems...Ch. 6.3 - Basic Computation: Find Probabilities In Problems...Ch. 6.3 - Basic Computation: Find Probabilities In Problems...Ch. 6.3 - Basic Computation: Find Probabilities In Problems...Ch. 6.3 - Basic Computation: Find Probabilities In Problems...Ch. 6.3 - Basic Computation: Find Probabilities In Problems...Ch. 6.3 - Basic Computation: Find Probabilities In Problems...Ch. 6.3 - Basic Computation: Find Probabilities In Problems...Ch. 6.3 - Basic Computation: Find Probabilities In Problems...Ch. 6.3 - Basic Computation: Find z Values In Problems 1524,...Ch. 6.3 - Basic Computation: Find z Values In Problems 1524,...Ch. 6.3 - Basic Computation: Find z Values In Problems 1524,...Ch. 6.3 - Basic Computation: Find z Values In Problems 1524,...Ch. 6.3 - Basic Computation: Find z Values In Problems 1524,...Ch. 6.3 - Prob. 20PCh. 6.3 - Prob. 21PCh. 6.3 - Basic Computation: Find z Values In Problems 1524,...Ch. 6.3 - Prob. 23PCh. 6.3 - Prob. 24PCh. 6.3 - Prob. 25PCh. 6.3 - Prob. 26PCh. 6.3 - Archaeology: Hopi Village Thickness measurements...Ch. 6.3 - Law Enforcement: Police Response Time Police...Ch. 6.3 - Prob. 29PCh. 6.3 - Guarantee: Watches Accrotime is a manufacturer of...Ch. 6.3 - Expand Your Knowledge: Estimating the Standard...Ch. 6.3 - Estimating the Standard Deviation: Refrigerator...Ch. 6.3 - Prob. 33PCh. 6.3 - Prob. 34PCh. 6.3 - Insurance: Satellites A relay microchip in a...Ch. 6.3 - Convertion Center: Exhibition Show Attendance...Ch. 6.3 - Exhibition Shows: Inverse Normal Distribution Most...Ch. 6.3 - Budget: Maintenance The amount of money spent...Ch. 6.3 - Prob. 39PCh. 6.3 - Prob. 40PCh. 6.4 - Prob. 1PCh. 6.4 - Prob. 2PCh. 6.4 - Prob. 3PCh. 6.4 - Prob. 4PCh. 6.4 - Prob. 5PCh. 6.4 - Prob. 6PCh. 6.4 - Prob. 7PCh. 6.4 - Prob. 8PCh. 6.4 - Prob. 9PCh. 6.5 - Statistical Literacy What is the standard error of...Ch. 6.5 - Prob. 2PCh. 6.5 - Prob. 3PCh. 6.5 - Prob. 4PCh. 6.5 - Basic Computation: Central Limit Theorem Suppose x...Ch. 6.5 - Basic Computation: Central Limit Theorem Suppose x...Ch. 6.5 - Prob. 7PCh. 6.5 - Prob. 8PCh. 6.5 - Prob. 9PCh. 6.5 - Prob. 10PCh. 6.5 - Prob. 11PCh. 6.5 - Critical Thinking Suppose an x distribution has...Ch. 6.5 - Prob. 13PCh. 6.5 - Vital Statistics: Heights of Men The heights of...Ch. 6.5 - Prob. 15PCh. 6.5 - Medical: White Blood Cells Let x be a random...Ch. 6.5 - Wildlife: Deer Let x be a random variable that...Ch. 6.5 - Focus Problem: Impulse Buying Let x represent the...Ch. 6.5 - Finance: Templeton Funds Templeton World is a...Ch. 6.5 - Finance: European Growth Fund A European growth...Ch. 6.5 - Expand Your Knowledge: Totals Instead of Averages...Ch. 6.5 - Prob. 22PCh. 6.5 - Prob. 23PCh. 6.6 - Prob. 1PCh. 6.6 - Prob. 2PCh. 6.6 - Basic Computation: Normal Approximation to a...Ch. 6.6 - Basic Computation: Normal Approximation to a...Ch. 6.6 - Critical Thinking You need to compute the...Ch. 6.6 - Critical Thinking Consider a binomial experiment...Ch. 6.6 - In the following problems, check that it is...Ch. 6.6 - In the following problems, check that it is...Ch. 6.6 - Prob. 9PCh. 6.6 - Prob. 10PCh. 6.6 - Prob. 11PCh. 6.6 - Prob. 12PCh. 6.6 - Prob. 13PCh. 6.6 - In the following problems, check that it is...Ch. 6.6 - Prob. 15PCh. 6.6 - Prob. 17PCh. 6.6 - Prob. 18PCh. 6.6 - Prob. 19PCh. 6.6 - Basic Computation: p Distribution Suppose we have...Ch. 6.6 - Prob. 21PCh. 6 - Prob. 1CRPCh. 6 - Prob. 2CRPCh. 6 - Statistical Literacy Is a process in control if...Ch. 6 - Prob. 4CRPCh. 6 - Prob. 5CRPCh. 6 - Prob. 6CRPCh. 6 - Prob. 7CRPCh. 6 - Prob. 8CRPCh. 6 - Prob. 9CRPCh. 6 - Prob. 10CRPCh. 6 - Prob. 11CRPCh. 6 - Basic Computation: Probability Given that x is a...Ch. 6 - Prob. 13CRPCh. 6 - Prob. 14CRPCh. 6 - Prob. 15CRPCh. 6 - Prob. 16CRPCh. 6 - Prob. 17CRPCh. 6 - Prob. 18CRPCh. 6 - Prob. 19CRPCh. 6 - Prob. 20CRPCh. 6 - Prob. 21CRPCh. 6 - Prob. 22CRPCh. 6 - Prob. 23CRPCh. 6 - Prob. 24CRPCh. 6 - Prob. 25CRPCh. 6 - Prob. 26CRPCh. 6 - Break into small groups and discuss the following...Ch. 6 - Prob. 1LCCh. 6 - Prob. 2LCCh. 6 - Prob. 3LCCh. 6 - Prob. 4LCCh. 6 - Discuss each of the following topics in class or...Ch. 6 - Prob. 1UTCh. 6 - Prob. 1CURPCh. 6 - Prob. 2CURPCh. 6 - Prob. 3CURPCh. 6 - Prob. 4CURPCh. 6 - Prob. 5CURPCh. 6 - Prob. 6CURPCh. 6 - Prob. 7CURPCh. 6 - Prob. 8CURPCh. 6 - Prob. 9CURPCh. 6 - Prob. 10CURPCh. 6 - Prob. 11CURPCh. 6 - Prob. 12CURPCh. 6 - Prob. 13CURPCh. 6 - Prob. 14CURPCh. 6 - Prob. 15CURP
Knowledge Booster
Background pattern image
Statistics
Learn more about
Need a deep-dive on the concept behind this application? Look no further. Learn more about this topic, statistics and related others by exploring similar questions and additional content below.
Recommended textbooks for you
  • Text book image
    Calculus For The Life Sciences
    Calculus
    ISBN:9780321964038
    Author:GREENWELL, Raymond N., RITCHEY, Nathan P., Lial, Margaret L.
    Publisher:Pearson Addison Wesley,
Text book image
Calculus For The Life Sciences
Calculus
ISBN:9780321964038
Author:GREENWELL, Raymond N., RITCHEY, Nathan P., Lial, Margaret L.
Publisher:Pearson Addison Wesley,
Continuous Probability Distributions - Basic Introduction; Author: The Organic Chemistry Tutor;https://www.youtube.com/watch?v=QxqxdQ_g2uw;License: Standard YouTube License, CC-BY
Probability Density Function (p.d.f.) Finding k (Part 1) | ExamSolutions; Author: ExamSolutions;https://www.youtube.com/watch?v=RsuS2ehsTDM;License: Standard YouTube License, CC-BY
Find the value of k so that the Function is a Probability Density Function; Author: The Math Sorcerer;https://www.youtube.com/watch?v=QqoCZWrVnbA;License: Standard Youtube License