
Probability and Statistics for Engineering and the Sciences
9th Edition
ISBN: 9781305251809
Author: Jay L. Devore
Publisher: Cengage Learning
expand_more
expand_more
format_list_bulleted
Concept explainers
Videos
Textbook Question
Chapter 7, Problem 56SE
The accompanying data on crack initiation depth (μm) was read from a lognormal probability plot that appeared in the article “Incorporating Small Fatigue Crack Growth in Probabilistic Life Prediction: Effect of Stress Ratio in Ti-6Al-2Sn-6Mo” (Intl. J. of Fatigue, 2013: 83–95). Although the pattern in the plot was quite straight, a normal probability plot of the data also shows a reasonably linear pattern. And a boxplot indicates that the distribution is quite symmetric in the middle 50% of the data and only mildly skewed overall. It is therefore reasonable to estimate and predict using t intervals.
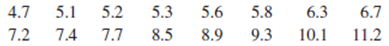
- a. Estimate the true average crack initiation depth with a 99% CI and interpret the resulting interval.
- b. Predict the value of a single crack initiation depth by constructing a 99% PI.
- c. Interpret in context the
meaning of 99% in (b).
Expert Solution & Answer

Trending nowThis is a popular solution!

Students have asked these similar questions
Young's modulus is a quantitative measure of stiffness of an elastic material. Suppose that for aluminum alloy sheets of a particular type, its mean value and standard deviation are 70 GPa and 1.6 GPa, respectively (values given in the article "Influence of Material Properties Variability on Springback and Thinning in Sheet Stamping Processes: A Stochastic Analysis" (Intl. J. of Advanced Manuf. Tech., 2010: 117–134)).
(a) If X is the sample mean Young's modulus for a random sample of
n = 16
sheets, where is the sampling distribution of X centered, and what is the standard deviation of the X distribution?
E(X)
=
GPa
? X
=
GPa
(b) Answer the questions posed in part (a) for a sample size of
n = 64
sheets.
E(X)
=
GPa
? X
=
GPa
(c) For which of the two random samples, the one of part (a) or the one of part (b), is X more likely to be within 1 GPa of 70 GPa? Explain your reasoning.
X is more likely to be within 1 GPa of the mean in part (a). This is due to…
Young's modulus is a quantitative measure of stiffness of an elastic material. Suppose that for aluminum alloy sheets of a particular type, its mean value and standard deviation are 70 GPa and 1.6 GPa, respectively (values given in the article "Influence of Material Properties Variability on Springback and Thinning in Sheet Stamping Processes: A Stochastic Analysis" (Intl. J. of Advanced Manuf. Tech., 2010: 117–134)).
(a) If X is the sample mean Young's modulus for a random sample of
n = 16
sheets, where is the sampling distribution of X centered, and what is the standard deviation of the X distribution?
E(X)
=
GPa
? X
=
GPa
(b) Answer the questions posed in part (a) for a sample size of
n = 64
sheets.
E(X)
=
GPa
? X
=
GPa
Young's modulus is a quantitative measure of stiffness of an elastic material. Suppose that for aluminum alloy sheets of a particular type, its mean value and standard deviation are 70 GPa and 1.6 GPa, respectively (values given in the article "Influence of Material Properties Variability on Springback and Thinning in Sheet Stamping Processes: A Stochastic Analysis" (Intl. J. of Advanced Manuf. Tech., 2010: 117–134)).
(a) If X is the sample mean Young's modulus for a random sample of
n = 16
sheets, where is the sampling distribution of X centered, and what is the standard deviation of the X distribution?
E(X)
=
GPa
? X
=
GPa
(b) Answer the questions posed in part (a) for a sample size of
n = 256
sheets.
E(X)
=
GPa
? X
=
GPa
(c) For which of the two random samples, the one of part (a) or the one of part (b), is X more likely to be within 1 GPa of 70 GPa? Explain your reasoning.
X is more likely to be within 1 GPa of the mean in part (a). This is due…
Chapter 7 Solutions
Probability and Statistics for Engineering and the Sciences
Ch. 7.1 - Consider a normal population distribution with the...Ch. 7.1 - Each of the following is a confidence interval for...Ch. 7.1 - Suppose that a random sample of 50 bottles of a...Ch. 7.1 - A CI is desired for the true average stray-load...Ch. 7.1 - Assume that the helium porosity (in percentage) of...Ch. 7.1 - On the basis of extensive tests, the yield point...Ch. 7.1 - By how much must the sample size n be increased if...Ch. 7.1 - Let 1 0, 2 0, with 1 + 2 = . Then P(z1X-/nz2)=1-...Ch. 7.1 - a. Under the same conditions as those leading to...Ch. 7.1 - A random sample of n = 15 heat pumps of a certain...
Ch. 7.1 - Consider the next 1000 95% CIs for that a...Ch. 7.2 - The following observations are lifetimes (days)...Ch. 7.2 - The article Gas Cooking. Kitchen Ventilation, and...Ch. 7.2 - The negative effects of ambient air pollution on...Ch. 7.2 - Determine the confidence level for each of the...Ch. 7.2 - The alternating current (AC) breakdown voltage of...Ch. 7.2 - Exercise 1.13 gave a sample of ultimate tensile...Ch. 7.2 - The U.S. Army commissioned a study to assess how...Ch. 7.2 - The article Limited Yield Estimation for Visual...Ch. 7.2 - TV advertising agencies face increasing challenges...Ch. 7.2 - In a sample of 1000 randomly selected consumers...Ch. 7.2 - The technology underlying hip replacements has...Ch. 7.2 - The Pew Forum on Religion and Public Life reported...Ch. 7.2 - A sample of 56 research cotton samples resulted in...Ch. 7.2 - The Pew Forum on Religion and Public Life reported...Ch. 7.2 - The superintendent of a large school district,...Ch. 7.2 - Reconsider the CI (7.10) for p, and focus on a...Ch. 7.3 - Determine the values of the following quantities:...Ch. 7.3 - Determine the t critical value(s) that will...Ch. 7.3 - Determine the t critical value for a two-sided...Ch. 7.3 - Determine the t critical value for a lower or an...Ch. 7.3 - According to the article Fatigue Testing of...Ch. 7.3 - The article Measuring and Understanding the Aging...Ch. 7.3 - A sample of 14 joint specimens of a particular...Ch. 7.3 - Silicone implant augmentation rhinoplasty is used...Ch. 7.3 - A normal probability plot of the n = 26...Ch. 7.3 - A study of the ability of individuals to walk in a...Ch. 7.3 - Ultra high performance concrete (UHPC) is a...Ch. 7.3 - Exercise 72 of Chapter 1 gave the following...Ch. 7.3 - Prob. 40ECh. 7.3 - A more extensive tabulation of t critical values...Ch. 7.4 - Determine the values of the following quantities:...Ch. 7.4 - Determine the following: a. The 95th percentile of...Ch. 7.4 - The amount of lateral expansion (mils) was...Ch. 7.4 - Wire electrical-discharge machining (WEDM) is a...Ch. 7.4 - Wire electrical-discharge machining (WEDM) is a...Ch. 7 - Example 1.11 introduced the accompanying...Ch. 7 - The article Distributions of Compressive Strength...Ch. 7 - For those of you who dont already know, dragon...Ch. 7 - A journal article reports that a sample of size 5...Ch. 7 - Unexplained respiratory symptoms reported by...Ch. 7 - High concentration of the toxic element arsenic is...Ch. 7 - Aphid infestation of fruit trees can be controlled...Ch. 7 - It is important that face masks used by...Ch. 7 - A manufacturer of college textbooks is interested...Ch. 7 - The accompanying data on crack initiation depth...Ch. 7 - In Example 6.8, we introduced the concept of a...Ch. 7 - Prob. 58SECh. 7 - Prob. 59SECh. 7 - Prob. 60SECh. 7 - Prob. 61SECh. 7 - Prob. 62SE
Knowledge Booster


Learn more about
Need a deep-dive on the concept behind this application? Look no further. Learn more about this topic, statistics and related others by exploring similar questions and additional content below.Similar questions
- What does the y -intercept on the graph of a logistic equation correspond to for a population modeled by that equation?arrow_forwardYoung's modulus is a quantitative measure of stiffness of an elastic material. Suppose that for aluminum alloy sheets of a particular type, its mean value and standard deviation are 70 GPa and 1.6 GPa, respectively (values given in the article "Influence of Material Properties Variability on Springback and Thinning in Sheet Stamping Processes: A Stochastic Analysis" (Intl. J. of Advanced Manuf. Tech., 2010: 117-134)). (a) If X is the sample mean Young's modulus for a random sample of n = 64 sheets, where is the sampling distribution of X centered, and what is the standard deviation of the X distribution? E(X) GPa GPa (b) Answer the questions posed in part (a) for a sample size of n = 256 sheets. E(X) = GPa GPa (c) For which of the two random samples, the one of part (a) or the one of part (b), is X more likely to be within 1 GPa of 70 GPa? Explain your reasoning. X is more likely to be within 1 GPa of the mean in part (b). This is due to the increased variability of X that comes with a…arrow_forwardYoung's modulus is a quantitative measure of stiffness of an elastic material. Suppose that for aluminum alloy sheets of a particular type, its mean value and standard deviation are 70 GPa and 1.6 GPa, respectively (values given in the article "Influence of Material Properties Variability on Springback and Thinning in Sheet Stamping Processes: A Stochastic Analysis" (Intl. J. of Advanced Manuf. Tech., 2010: 117-134)). (a) If X is the sample mean Young's modulus for a random sample of n = 64 sheets, where is the sampling distribution of X centered, and what is the standard deviation of the X distribution? E(X) ох = GPa GPa (b) Answer the questions posed in part (a) for a sample size of n = 256 sheets. E(X) GPa GPa ох = (c) For which of the two random samples, the one of part (a) or the one of part (b), is X more likely to be within 1 GPa of 70 GPa? Explain your reasoning. O X is more likely to be within 1 GPa of the mean in part (b). This is due to the increased variability of X that…arrow_forward
- Young's modulus is a quantitative measure of stiffness of an elastic material. Suppose that for aluminum alloy sheets of a particular type, its mean value and standard deviation are 70 GPa and 1.6 GPa, respectively (values given in the article "Influence of Material Properties Variability on Springback and Thinning in Sheet Stamping Processes: A Stochastic Analysis" (Intl. J. of Advanced Manuf. Tech., 2010: 117-134)). (a) If X is the sample mean Young's modulus for a random sample of n = 16 sheets, where is the sampling distribution of X centered, and what is the standard deviation of the X distribution? E(X) = GPa GPa x = (b) Answer the questions posed in part (a) for a sample size of n = 64 sheets. E(X) GPa GPa ox = (c) For which of the two random samples, the one of part (a) or the one of part (b), is X more likely to be within 1 GPa of 70 GPa? Explain your reasoning. O X is more likely to be within 1 GPa of the mean in part (b). This is due to the decreased variability of X that…arrow_forwardYoung's modulus is a quantitative measure of stiffness of an elastic material. Suppose that for aluminum alloy sheets of a particular type, its mean value and standard deviation are 70 GPa and 1.6 GPa, respectively (values given in the article "Influence of Material Properties Variability on Springback and Thinning in Sheet Stamping Processes: A Stochastic Analysis" (Intl. J. of Advanced Manuf. Tech., 2010: 117-134)). | If X is the sample mean Young's modulus for a random sample of n = 64 sheets, where is the sampling distribution of X centered, and what is the standard deviation of the X distribution? EX) = GPa GPa J Answer the questions posed in part (a) for a sample size of n = 256 sheets. E(X) = GPa GPa For which of the two random samples, the one part (a) or the one of part (b), is X more likely to be within 1 GPa of 70 GPa? Explain your reasoning. O X is more likely to be within 1 GPa of the mean in part (b). This is due to the increased variability of X that comes with a larger…arrow_forwardYoung's modulus is a quantitative measure of stiffness of an elastic material. Suppose that for aluminum alloy sheets of a particular type, its mean value and standard deviation are 70 GPa and 1.6 GPa, respectively (values given in the article "Influence of Material Properties Variability on Springback and Thinning in Sheet Stamping Processes: A Stochastic Analysis" (Intl. J. of Advanced Manuf. Tech., 2010: 117-134)). (a) If X is the sample mean Young's modulus for a random sample of n = 64 sheets, where is the sampling distribution of X centered, and what is the standard deviation of the X distribution? E(X) = GPa GPa ox= (b) Answer the questions posed in part (a) for a sample size of n = 256 sheets. E(X) = ox GPa GPa (c) For which of the two random samples, the one of part (a) or the one of part (b), is more likely to be within 1 GPa of 70 GPa? Explain your reasoning. O X is more likely to be within 1 GPa of the mean in part (a). This is due to the decreased variability of X that…arrow_forward
- A study was conducted that measured the total brain volume (TBV) (in ) of patients that had schizophrenia and patients that are considered normal. Table #9.3.5 contains the TBV of the normal patients and table #9.3.6 contains the TBV of schizophrenia patients ("SOCR data oct2009," 2013). Is there enough evidence to show that the patients with schizophrenia have less TBV on average than a patient that is considered normal? Test at the 10% level. (Show work) Table #9.3.5: Total Brain Volume (in ) of Normal Patients 1663407 1583940 1299470 1535137 1431890 1578698 1453510 1650348 1288971 1366346 1326402 1503005 1474790 1317156 1441045 1463498 1650207 1523045 1441636 1432033 1420416 1480171 1360810 1410213 1574808 1502702 1203344 1319737 1688990 1292641 1512571 1635918 Table #9.3.6: Total Brain Volume (in ) of Schizophrenia Patients 1331777 1487886 1066075 1297327 1499983…arrow_forwardAn article in Environment International ["influence of Water Temperature and Shower Head Office Size on the release Radon During Showering" (1992, Vol. 18(4)] described an experiment in which the amount of radon released in showers was imvestigated. Radon-enriched water was used in the experiment, and six different orifice diameters were tested in shower heads. The data from the experiment are shown in the following table. 5. Orifice Diameter 0.37 0.51 0.71 1.02 Radon Released () 83 75 73 72 83 85 79 79 74 76 77 67 74 74 1.40 62 62 67 69 1.99 60 64 66 (a) Does the size of the orifice affect the mean percentage of radon released? Use a=0.05. (b) Find a 95% confidence interval on the mean percent of radon released when the orifice diameter is 1.40.arrow_forward.. .. Young's modulus is a quantitative measure of stiffness of an elastic material. Suppose that for aluminum alloy sheets of a particular type, its mean value and standard deviation are 70 GPa and 1.6 GPa, respectively (values given in the article "Influence of Material Properties Variability on Springback and Thinning in Sheet Stamping Processes: A Stochastic Analysis" (Intl. J. of Advanced Manuf. Tech., 2010: 117-134)). (a) If X is the sample mean Young's modulus for a random sample of n = 16 sheets, where is the sampling distribution of X centered, and what is the standard deviation of the X distribution? E(X) GPa %3D GPa (b) Answer the questions posed in part (a) for a sample size of n = 64 sheets. E(X) = GPa GPa (c) For which of the two random samples, the one of part (a) or the one of part (b), is X more likely to be within 1 GPa of 70 GPa? Explain your reasoning. X is more likely to be within 1 GPa of the mean in part (b). This is due to the decreased variability of X that…arrow_forward
- sto ave 12.72 (M4) The authors of the paper "Serum Zinc Levels of Cord Blood: Relation to Birth Weight and Gestational Period" (Journal of Trace Elements in Medicine and Biology [2015]: 180-183) car- ried out a study of zinc levels of low-birth-weight babies and normal-birth-weight babies. For a sample of 50 low- birth-weight babies, the sample mean zinc level was 17.00 and the standard error was 0.43. For a sample of 73 normal-birth-weight babies, the sample mean zinc level was 18.16 and the standard error was 0.32. Explain why the two standard errors are not the same.arrow_forwardThe article “Monte Carlo Simulation—Tool for Better Understanding of LRFD” (J. of Structural Engr., 1993: 1586–1599) suggests that yield strength (ksi) for A36 grade steel is normally distributed with mean = 43 and standard deviation = 4.5.(a) What is the probability that yield strength is greater than 58? (b) What yield strength value separates the strongest 75% from the others?arrow_forwardwidely used as dielectrics and coolants in electrical systems in the past. They were found to be a major environmental contaminant in the 1960s. In a study, the mean PCB content at each of thirteen sites was reported for the years 1982 and 1996 (from “The ratio of DDE to PCB concentrations in Great Lakes herring gull eggs and its use in interpreting contaminants data”, Journal of Great Lakes Research 24 (1): 12-31, 1998). The data are below.Site:12345678910111213198261.4864.4745.5059.7058.8175.9671.5738.0630.5139.7029.7866.8963.93199613.9918.2611.2810.0221.0017.3628.207.3012.809.4112.6316.8322.74(a) Which test would be more appropriate in this case: a t-test for the difference between two population means, or a paired t-test? Why?(b) Do the data provide sufficient evidence to support the claim that the mean PCB level has decreased in the region? Be sure to check all assumptions, write the null and alternative hypotheses, calculate the appropriate test statistic, calculate the p-value,…arrow_forward
arrow_back_ios
SEE MORE QUESTIONS
arrow_forward_ios
Recommended textbooks for you

Statistics 4.1 Point Estimators; Author: Dr. Jack L. Jackson II;https://www.youtube.com/watch?v=2MrI0J8XCEE;License: Standard YouTube License, CC-BY
Statistics 101: Point Estimators; Author: Brandon Foltz;https://www.youtube.com/watch?v=4v41z3HwLaM;License: Standard YouTube License, CC-BY
Central limit theorem; Author: 365 Data Science;https://www.youtube.com/watch?v=b5xQmk9veZ4;License: Standard YouTube License, CC-BY
Point Estimate Definition & Example; Author: Prof. Essa;https://www.youtube.com/watch?v=OTVwtvQmSn0;License: Standard Youtube License
Point Estimation; Author: Vamsidhar Ambatipudi;https://www.youtube.com/watch?v=flqhlM2bZWc;License: Standard Youtube License