
Fundamentals of Statistics (5th Edition)
5th Edition
ISBN: 9780134508306
Author: Michael Sullivan III
Publisher: PEARSON
expand_more
expand_more
format_list_bulleted
Concept explainers
Videos
Textbook Question
Chapter 7.1, Problem 11AYU
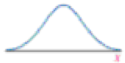
For Problems 7–12, determine whether the graph can represent a normal curve. If it cannot, explain why.
11. 
Expert Solution & Answer
Want to see the full answer?
Check out a sample textbook solution
Students have asked these similar questions
A researcher believes that the so-called “sugar high” is not real. He gathered 30 adolescents and recorded their activity level in the scale of 0 – 100 (0 = not active and 100 = super active). First, he recorded participants’ activity level before they consumed candy. After recording their pre-sugar activity level, the researcher gave out 5 Snickers bars to participants. Then, he recorded their post-sugar activity level. The average difference between post-sugar and pre-sugar activity level is 50 (i.e., the activity levels are higher after sugar than prior to it) with a standard deviation of 10.
A). Complete test statistic and critical values
B). Conclusion
A researcher believes that the so-called “sugar high” is not real. He gathered 30 adolescents and recorded their activity level in the scale of 0 – 100 (0 = not active and 100 = super active). First, he recorded participants’ activity level before they consumed candy. After recording their pre-sugar activity level, the researcher gave out 5 Snickers bars to participants. Then, he recorded their post-sugar activity level. The average difference between post-sugar and pre-sugar activity level is 50 (i.e., the activity levels are higher after sugar than prior to it) with a standard deviation of 10.
A). What is the type of test you will use? (z-test, single-sample t-test, paired-samples t-test, or independent samples t-test) and why (what information provided in the problem)B). What are the hypotheses (Be Specific)
You work as a data scientist for a real estate company in a seaside resort town. Your boss has asked you to discover if it's possible to predict how much a
home's distance from the water affects its selling price. You are going to collect a random sample of 9 recently sold homes in your town. You will note the
distance each hame is from the water (denoted by X, in km) and each home's selling price (denoted by y, in hundreds of thousands of dollars). You will also note
the product X-y oaf the distance from the water and selling price for each hame. (These products are written in the row labeled "Xy")-
(a) Click an "Take Sample" to see the results for your random sample.
Distance from the
water, X
3.8
21
1.3
0.2
29
21
4.4
1.3
1.8
(In lam)
Selling price, y
(In hundreds of thousands
of dollars)
Tako Sample
5.7
10.3
17.1
14.8
8.2
1.4
6.1
10.4
9.6
xy
21.66
21.63
22.23
2.96
23.78
15.54
26.84
13.52
17.28
Sand data to calculator v
Based on the data from your sample, enter the indicated values…
Chapter 7 Solutions
Fundamentals of Statistics (5th Edition)
Ch. 7.1 - A _____ _____ _____ is an equation used to compute...Ch. 7.1 - A _______ is an equation, table, or graph used to...Ch. 7.1 - True or False: The normal curve is symmetric about...Ch. 7.1 - The area under the normal curve to the right of ...Ch. 7.1 - The points at x = _____ and x = _____ are the...Ch. 7.1 - The area under a normal curve can be interpreted...Ch. 7.1 - For Problems 712, determine whether the graph can...Ch. 7.1 - For Problems 712, determine whether the graph can...Ch. 7.1 - For Problems 712, determine whether the graph can...Ch. 7.1 - Prob. 10AYU
Ch. 7.1 - For Problems 712, determine whether the graph can...Ch. 7.1 - For Problems 712, determine whether the graph can...Ch. 7.1 - Problems 1316 use the information presented in...Ch. 7.1 - Problems 1316 use the information presented in...Ch. 7.1 - Prob. 15AYUCh. 7.1 - Problems 1316 use the information presented in...Ch. 7.1 - Uniform Distribution The random-number generator...Ch. 7.1 - Uniform Distribution The reaction time X (in...Ch. 7.1 - In Problems 1922, determine whether or not the...Ch. 7.1 - In Problems 1922, determine whether or not the...Ch. 7.1 - In Problems 1922, determine whether or not the...Ch. 7.1 - In Problems 1922, determine whether or not the...Ch. 7.1 - One graph in the figure on the following page...Ch. 7.1 - One graph in the figure below represents a normal...Ch. 7.1 - In Problems 2528, the graph of a normal curve is...Ch. 7.1 - In Problems 2528, the graph of a normal curve is...Ch. 7.1 - Prob. 27AYUCh. 7.1 - In Problems 2528, the graph of a normal curve is...Ch. 7.1 - In Problems 29 and 30, draw a normal curve and...Ch. 7.1 - Prob. 30AYUCh. 7.1 - NW You Explain It! Cell Phone Rates Monthly...Ch. 7.1 - You Explain It! Refrigerators The lives of...Ch. 7.1 - You Explain It! Birth Weights The birth weights of...Ch. 7.1 - You Explain It! Height of 10-Year-Old Males The...Ch. 7.1 - NW You Explain It! Gestation Period The lengths of...Ch. 7.1 - Prob. 36AYUCh. 7.1 - Hitting with a Pitching Wedge In the game of golf,...Ch. 7.1 - Heights of Five-Year-Old Females The following...Ch. 7.1 - Cardiac Arrest Researchers conducted a prospective...Ch. 7.2 - A random variable Z that is normally distributed...Ch. 7.2 - The notation z is the z-score such that the area...Ch. 7.2 - If X is a normal random variable with mean 40 and...Ch. 7.2 - If X is normal random variable with mean 40 and...Ch. 7.2 - In Problems 512, find the indicated areas. For...Ch. 7.2 - In Problems 512, find the indicated areas. For...Ch. 7.2 - In Problems 512, find the indicated areas. For...Ch. 7.2 - In Problems 512, find the indicated areas. For...Ch. 7.2 - In Problems 512, find the indicated areas. For...Ch. 7.2 - In Problems 512, find the indicated areas. For...Ch. 7.2 - In Problems 512, find the indicated areas. For...Ch. 7.2 - In Problems 512, find the indicated areas. For...Ch. 7.2 - In Problems 1318, find the indicated z-score. Be...Ch. 7.2 - In Problems 1318, find the indicated z-score. Be...Ch. 7.2 - In Problems 1318, find the indicated z-score. Be...Ch. 7.2 - In Problems 1318, find the indicated z-score. Be...Ch. 7.2 - In Problems 1318, find the indicated z-score. Be...Ch. 7.2 - In Problems 1318, find the indicated z-score. Be...Ch. 7.2 - In Problems 1922, find the value of z. 19. NW...Ch. 7.2 - In Problems 1922, find the value of z. 20. z0.02Ch. 7.2 - In Problems 1922, find the value of z. 21. z0.025Ch. 7.2 - In Problems 1922, find the value of z. 22. z0.015Ch. 7.2 - In Problems 2332, assume that the random variable...Ch. 7.2 - In Problems 2332, assume that the random variable...Ch. 7.2 - In Problems 2332, assume that the random variable...Ch. 7.2 - In Problems 2332, assume that the random variable...Ch. 7.2 - In Problems 2332, assume that the random variable...Ch. 7.2 - In Problems 2332, assume that the random variable...Ch. 7.2 - In Problems 2332, assume that the random variable...Ch. 7.2 - In Problems 2332, assume that the random variable...Ch. 7.2 - In Problems 2332, assume that the random variable...Ch. 7.2 - In Problems 2332, assume that the random variable...Ch. 7.2 - In Problems 3336, assume that the random variable...Ch. 7.2 - In Problems 3336, assume that the random variable...Ch. 7.2 - In Problems 3336, assume that the random variable...Ch. 7.2 - In Problems 3336, assume that the random variable...Ch. 7.2 - Egg Incubation Times The mean incubation time of...Ch. 7.2 - Reading Rates The reading speed of sixth-grade...Ch. 7.2 - NW Chips Ahoy! Cookies The number of chocolate...Ch. 7.2 - Wendys Drive-Through Fast-food restaurants spend...Ch. 7.2 - Gestation Period The lengths of human pregnancies...Ch. 7.2 - Light Bulbs General Electric manufactures a...Ch. 7.2 - Manufacturing Steel rods are manufactured with a...Ch. 7.2 - Manufacturing Ball bearings are manufactured with...Ch. 7.2 - NCAA Basketball Point Spreads In sports betting,...Ch. 7.2 - Prob. 46AYUCh. 7.2 - NW Egg Incubation Times The mean incubation time...Ch. 7.2 - Reading Rates The reading speed of sixth-grade...Ch. 7.2 - Chips Ahoy! Cookies The number of chocolate chips...Ch. 7.2 - Wendys Drive-Through Fast-food restaurants spend...Ch. 7.2 - Speedy Lube The time required for Speedy Lube to...Ch. 7.2 - Putting It Together: Birth Weights The following...Ch. 7.2 - Prob. 53AYUCh. 7.2 - Prob. 54AYUCh. 7.2 - Explain why P(X 220) should be reported as ...Ch. 7.2 - The ACT and SAT are two college entrance exams....Ch. 7.3 - A _____ _____ _____ is a graph that plots observed...Ch. 7.3 - True or False: A normal score is the expected...Ch. 7.3 - In Problems 36, use the results in the table to...Ch. 7.3 - In Problems 36, use the results in the table to...Ch. 7.3 - In Problems 36, use the results in the table to...Ch. 7.3 - In Problems 36, use the results in the table to...Ch. 7.3 - In Problems 710, use a normal probability plot to...Ch. 7.3 - In Problems 710, use a normal probability plot to...Ch. 7.3 - In Problems 710, use a normal probability plot to...Ch. 7.3 - In Problems 710, use a normal probability plot to...Ch. 7.3 - Chips per Bag In a 1998 advertising campaign,...Ch. 7.3 - Hours of TV A random sample of college students...Ch. 7.3 - Putting It Together: Demon Roller Coaster Retrieve...Ch. 7.4 - In a binomial experiment with n trials and...Ch. 7.4 - When adding or subtracting 0.5 from X, we are...Ch. 7.4 - Suppose X is a binomial random variable. To...Ch. 7.4 - Suppose X is a binomial random variable. To...Ch. 7.4 - In Problems 514, a discrete random variable is...Ch. 7.4 - In Problems 514, a discrete random variable is...Ch. 7.4 - In Problems 514, a discrete random variable is...Ch. 7.4 - In Problems 514, a discrete random variable is...Ch. 7.4 - Prob. 9AYUCh. 7.4 - In Problems 514, a discrete random variable is...Ch. 7.4 - Prob. 11AYUCh. 7.4 - In Problems 514, a discrete random variable is...Ch. 7.4 - Prob. 13AYUCh. 7.4 - Prob. 14AYUCh. 7.4 - In Problems 1520, compute P(x) using the binomial...Ch. 7.4 - In Problems 1520, compute P(x) using the binomial...Ch. 7.4 - In Problems 1520, compute P(x) using the binomial...Ch. 7.4 - In Problems 1520, compute P(x) using the binomial...Ch. 7.4 - Prob. 19AYUCh. 7.4 - Prob. 20AYUCh. 7.4 - NW On-Time Flights According to American Airlines,...Ch. 7.4 - Prob. 22AYUCh. 7.4 - Prob. 23AYUCh. 7.4 - Sneeze According to a study done by Nick Wilson of...Ch. 7.4 - Males Living at Home According to the Current...Ch. 7.4 - Females Living at Home According to the Current...Ch. 7.4 - NW Boys Are Preferred In a Gallup poll, 37% of...Ch. 7.4 - Liars According to a USA Today Snapshot, 3% of...Ch. 7 - Use the figure to answer the questions that...Ch. 7 - In Problems 2 and 3, draw a standard normal curve...Ch. 7 - In Problems 2 and 3, draw a standard normal curve...Ch. 7 - Find the z-score such that the area to the right...Ch. 7 - Prob. 5RECh. 7 - Prob. 6RECh. 7 - Prob. 7RECh. 7 - Prob. 8RECh. 7 - Prob. 9RECh. 7 - Tire Wear Suppose that Dunlop Tire manufactures a...Ch. 7 - Wechsler Intelligence Scale The Wechsler...Ch. 7 - Major League Baseballs According to Major League...Ch. 7 - America Reads According to a Gallup poll, 46% of...Ch. 7 - Prob. 14RECh. 7 - Hector obtained a random sample of twenty recent...Ch. 7 - Density of Earth In 1798, Henry Cavendish obtained...Ch. 7 - Creative Thinking According to a USA Today...Ch. 7 - A continuous random variable X is uniformly...Ch. 7 - List the properties of the normal density curve.Ch. 7 - Prob. 20RECh. 7 - Prob. 1CTCh. 7 - Prob. 2CTCh. 7 - Prob. 3CTCh. 7 - Prob. 4CTCh. 7 - Prob. 5CTCh. 7 - Suppose that the talk time on the Apple iPhone is...Ch. 7 - The waist circumference of males 2029 years old is...Ch. 7 - Suppose the scores earned on Professor McArthurs...Ch. 7 - In a poll conducted by the Gallup organization,...Ch. 7 - Prob. 10CTCh. 7 - A continuous random variable X is uniformly...Ch. 7 - The reference interval for HDL cholesterol is...
Knowledge Booster


Learn more about
Need a deep-dive on the concept behind this application? Look no further. Learn more about this topic, statistics and related others by exploring similar questions and additional content below.Similar questions
- The last part of this assignment is to write a paragraph about what you could do if you had a highly skewed data set to make it more normal.arrow_forwardSuppose classmates who graduated in 2004 compared their median incomes ten years later. The bar graph displays the median income, in thousands of dollars, for each classmate during the time intervals from 2005‑2009 and 2010‑2014. For the individual with the largest dollar value increase in median income over the two time intervals, determine the amount of increase.arrow_forward(3.7) #2arrow_forward
- The following table shows the daily number of watches sold at a shop and the amount of money made from the sales. What is the average rate of change in revenue from w = 20 to w =25.arrow_forwardThe full data is on the 2nd picturearrow_forwardSuppose that 95% of the bags of certain fertilizer mix weigh between 49 and 53 pounds. Averages of three succesive bags were plotted, and 47.5% of these were observed to lie between 51 and X pounds. Estimate the value of X. State assumptions you make and say whether these assumptions are likely to be true for this example.arrow_forward
- The graph above shows a line of best fit for data collected on the number of calories in relation to the grams of fat of different types of food. What is the equation of the line of best fit?arrow_forwardConsider the model y=-2.45x+7.18 derived from data between x=4 and x=10. What value of x represents interpolation of the data?arrow_forwardThis value represents how much a change in one variable can be predicted from its relationship witha completely different variable .......arrow_forward
- Based on the data,arrow_forwardI'm struggling with how to get the p value from the data in the top right corner of the picturearrow_forwardJohn calculated r -.44 for a set of n 10 pairs of values that represent the number of absences from class (X) and students midterm exam scores (Y). How much of the variability in exam scores can be predicted from the relationship with the number of absences?arrow_forward
arrow_back_ios
SEE MORE QUESTIONS
arrow_forward_ios
Recommended textbooks for you
 Glencoe Algebra 1, Student Edition, 9780079039897...AlgebraISBN:9780079039897Author:CarterPublisher:McGraw Hill
 Algebra & Trigonometry with Analytic GeometryAlgebraISBN:9781133382119Author:SwokowskiPublisher:Cengage
Glencoe Algebra 1, Student Edition, 9780079039897...
Algebra
ISBN:9780079039897
Author:Carter
Publisher:McGraw Hill
Algebra & Trigonometry with Analytic Geometry
Algebra
ISBN:9781133382119
Author:Swokowski
Publisher:Cengage
The Shape of Data: Distributions: Crash Course Statistics #7; Author: CrashCourse;https://www.youtube.com/watch?v=bPFNxD3Yg6U;License: Standard YouTube License, CC-BY
Shape, Center, and Spread - Module 20.2 (Part 1); Author: Mrmathblog;https://www.youtube.com/watch?v=COaid7O_Gag;License: Standard YouTube License, CC-BY
Shape, Center and Spread; Author: Emily Murdock;https://www.youtube.com/watch?v=_YyW0DSCzpM;License: Standard Youtube License