
Videos
Testing the Difference Between Two Means In Exercises 9–20, (a) identify the claim and state H0 and Ha, (b) find the critical value(s) and identify the rejection region(s), (c) calculate
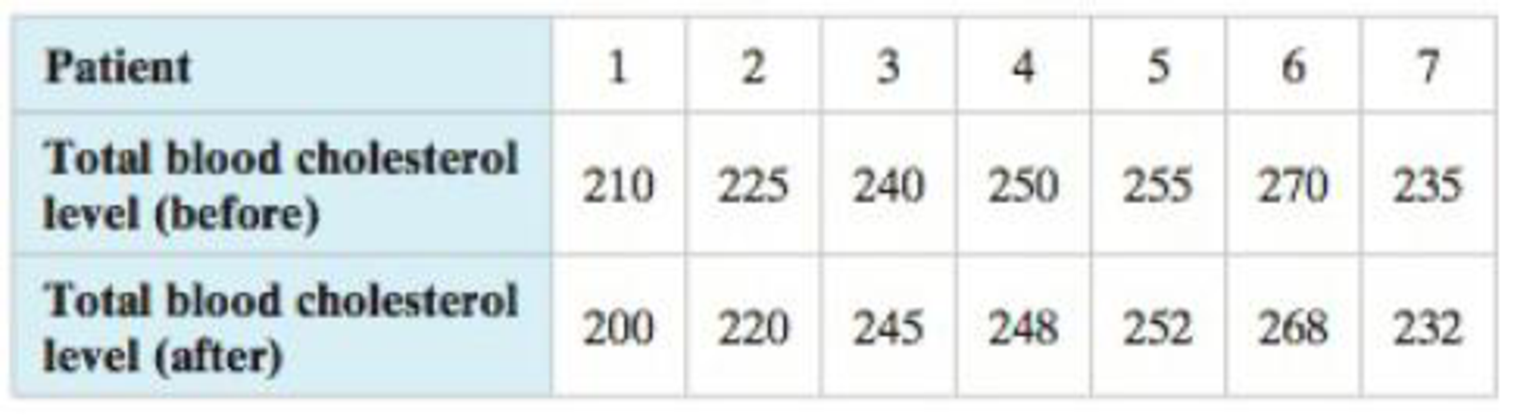
19. Cholesterol Levels A food manufacturer claims that eating its new cereal as part of a daily diet lowers total blood cholesterol levels. The table shows the total blood cholesterol levels (in milligrams per deciliter of blood) of seven patients before eating the cereal and after one year of eating the cereal as part of their diets. At α = 0.05, is there enough evidence to support the food manufacturer’s claim?
Want to see the full answer?
Check out a sample textbook solution
Chapter 8 Solutions
Elementary Statistics: Picturing the World (7th Edition)


- (a) Identify the claim and state H0 and Ha. (b) Find the critical value(s) and identify the rejection region(s). (c) Find the standardized test statistic. (d) Decide whether to reject or fail to reject the null hypothesis. (e) Interpret the decision in the context of the original claim.arrow_forwardIn a statistical test, we have a choice of a left-tailed test, a right-tailed test, or a two-tailed test. Is it the null hypothesis or the alternate hypothesis that determines which type of test is used? Explain your answer. The alternative hypothesis because it specifies what the level of significance of the test will be. The null hypothesis because it specifies what the level of significance of the test will be. The null hypothesis because it specifies the region of interest for the parameter in question. The alternative hypothesis because it specifies the region of interest for the parameter in question.arrow_forward(b) Find the critical value(s) and identify the rejection region(s). (c) Find the standardized test statistic t. (d) Decide whether to reject or fail to reject the null hypothesis. (e) Interpret the decision in the context of the original claim.arrow_forward
- Test the claim that the mean GPA of Orange Coast students is larger than the mean GPA of Coastline students at the 0.01 significance level. The null and alternative hypothesis would be: Ho:μο = μc Ho:μο με H1:po pc Hy:μο < με Reject the null hypothesis O Fail to reject the null hypothesis (to 2 decimals) (to 2 decimals)arrow_forward(a) Identify the claim and state H0 and Ha.What is the claim? Let Region A be sample 1 and let Region B be sample 2. Identify H0 and Ha. (b) Find the critical value(s) and identify the rejection region. What is the rejection region? (c) Find the standardized test statistic z. (d) Decide whether to reject or fail to reject the null hypothesis and interpret the decision in the context of the original claim.arrow_forward(a) Identify the claim and state H0 and Ha. (b) Find the critical value(s) and identify the rejection region(s). (c) Find the standardized test statistic, z. (d) Decide whether to reject or fail to reject the null hypothesis. (e) Interpret the decision in the context of the original claimarrow_forward
- Test the claim that the mean GPA of night students is significantly different than the mean GPA of day students at the 0.05 significance level. The null and alternative hypothesis would be: Ho:PN 2 PD Ho:PN = PD Ho: PN PD H1:UN > HD H1:uN Next Question M hparrow_forwardTest the claim that the proportion of people who own cats is larger than 20% at the 0.005 significance level. The null and alternative hypothesis would be: H2:p = 0.2 Họ:p 2 0.2 H9:p 0.2 H9:p = 0.2 Hg: u 0.2 H1: u 0.2 The test is: left-tailed two-tailed right-tailed Based on a sample of 300 people, 24% owned cats The test statistic is: (to 2 decimals) The p-value is: (to 2 decimals) Based on this we: O Reject the null hypothesis O Fail to reject the null hypothesisarrow_forwardWork Conduct the hypothesis test and provide the test statistic and the critical value, and state the conclusion. A person drilled a hole in a die and filled it with a lead weight, then proceeded to roll it 200 times. Here are the observed frequencies for the outcomes of 1, 2, 3, 4, 5, and 6, respectively: 27, 29, 50, 41, 29, 24. Use a 0.10 significance level to test the claim that the outcomes are not equally likely. Does it appear that the loaded die behaves differently than a fair die? Click here to view the chi-square distribution table. The test statistic is. (Round to three decimal places as needed.) The critical value is (Round to three decimal places as needed.) State the conclusion. Ho- There sufficient evidence to support the claim that the outcomes are not equally likely. The outcomes to be equally likely, so the loaded die to behave differently from a fair die.arrow_forward
- Illustrate the null hypothesis for a correlated t test?arrow_forwardFind the test statistic for this hypothesis test. Z= Determine the P Value P-Value=arrow_forward(a) Identify the claim and state H0 and Ha. (b) Find the critical value(s) and identify the rejection region(s). (c) Find the standardized test statistic z. (d) Decide whether to reject or fail to reject the null hypothesis and (e) interpret the decision in the context of the original claim.arrow_forward
 Calculus For The Life SciencesCalculusISBN:9780321964038Author:GREENWELL, Raymond N., RITCHEY, Nathan P., Lial, Margaret L.Publisher:Pearson Addison Wesley,