
Videos
Using Table G, find the critical value(s) for each. Show the critical and noncritical regions, and state the appropriate null and alternative hypotheses. Use σ2 = 225.
a. α = 0.01, n = 17, right-tailed
b. α = 0.025, n = 20, left-tailed
c. α = 0.01, n = 13, two-tailed
d. α = 0.025, n = 29, left-tailed
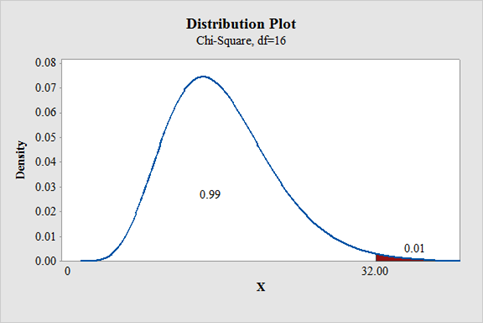
a.
To find: The critical value for right tailed test.
Answer to Problem 2E
The critical value for right tailed test is 32.000.
Null hypothesis:
Alternative hypothesis:
Explanation of Solution
The level of significance is
Answer:
Degrees of freedom:
From “Table G: The chi square distribution”, the critical values for the
Software Procedure:
Degrees of freedom:
From “Table G: The chi square distribution”, the critical values for the
Software Procedure:
Step-by-step procedure to obtain the critical region using the MINITAB software:
- Choose Graph > Probability Distribution Plot > choose View Probability> OK.
- From Distribution, choose Chi-square.
- In Degrees of freedom, enter 16.
- Click the Shaded Area tab.
- Choose Probability value and Right Tail for the region of the curve to shade.
- Enter the Probability value as 0.01.
- Click OK.
Output using the MINITAB software is given below:
State the null and alternative hypotheses:
Null hypothesis:
Alternative hypothesis:
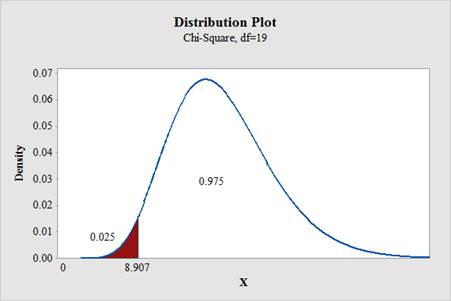
b.
To find: The critical value for left tailed test.
Answer to Problem 2E
The critical value for left tailed test is 8.907.
Null hypothesis:
Alternative hypothesis:
Explanation of Solution
The level of significance is
Solution:
Degrees of freedom:
If the test is left tail, the level of significance is subtracted from 1. That is,
From “Table G: The chi square distribution”, the critical values for the
Software Procedure:
Step-by-step procedure to obtain the critical region using the MINITAB software:
- Choose Graph > Probability Distribution Plot > choose View Probability> OK.
- From Distribution, choose Chi-square.
- In Degrees of freedom, enter 19.
- Click the Shaded Area tab.
- Choose Probability value and Left Tail for the region of the curve to shade.
- Enter the Probability value as 0.025.
- Click OK.
Output using the MINITAB software is given below:
State the null and alternative hypotheses:
Null hypothesis:
Alternative hypothesis:
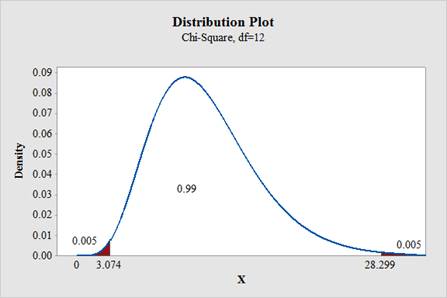
c.
To find: The critical values for two tailed test.
Answer to Problem 2E
The critical values for two tailed test is 3.074 and 28.299, respectively.
Null hypothesis:
Alternative hypothesis:
Explanation of Solution
Given info:
The level of significance is
Solution:
Degrees of freedom:
The area to the right of larger value is,
From “Table G: The chi square distribution”, the critical values for the
Software Procedure:
Step-by-step procedure to obtain the critical region using the MINITAB software:
- Choose Graph > Probability Distribution Plot > choose View Probability> OK.
- From Distribution, choose Chi-square.
- In Degrees of freedom, enter 12.
- Click the Shaded Area tab.
- Choose Probability value and Both Tail for the region of the curve to shade.
- Enter the Probability value as 0.01.
- Click OK.
Output using the MINITAB software is given below:
State the null and alternative hypotheses:
Null hypothesis:
Alternative hypothesis:
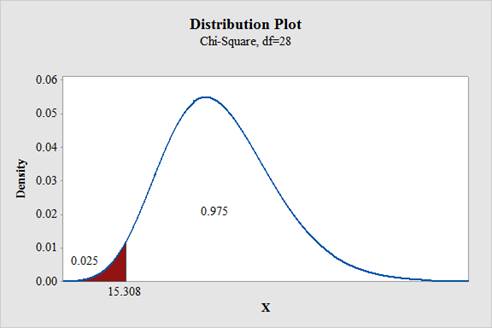
d.
To find: The critical value for left tailed test.
Answer to Problem 2E
The critical value for left tailed test is 15.308.
Null hypothesis:
Alternative hypothesis:
Explanation of Solution
Given info:
The level of significance is
Solution:
Degrees of freedom:
If the test is left tail, the level of significance is subtracted from 1. That is,
From “Table G: The chi square distribution”, the critical values for the
Software Procedure:
Step-by-step procedure to obtain the critical region using the MINITAB software:
- Choose Graph > Probability Distribution Plot > choose View Probability> OK.
- From Distribution, choose Chi-square.
- In Degrees of freedom, enter 28.
- Click the Shaded Area tab.
- Choose Probability value and Left Tail for the region of the curve to shade.
- Enter the Probability value as 0.025.
- Click OK.
Output using the MINITAB software is given below:
State the null and alternative hypotheses:
Null hypothesis:
Alternative hypothesis:
Want to see more full solutions like this?
Chapter 8 Solutions
Elementary Statistics: A Step By Step Approach


- Pet Owners A study of pet owners showed the following information concerning the ownership of the dogs and cats. At =α0.10 , is there a relationship between the number of people in a family and dog or cat ownership? Use the critical value method with tables. 1 person 2 people 3 people 4 or more people Dog 5 15 10 25 Cat 10 15 15 15 1)State the hypotheses and identify the claim. H0: Pet ownership is ▼(DEPENDANT ON or INDEPENDANT OF?) the number of people living in the household. (CLAIM OR NOT CLAIM?) H1 : Pet ownership is (DEPENDANT ON or INDEPENDANT OF?) the number of people living in the household. (CLAIM OR NOT CLAIM?) 2. Find the critical value 3. Compute the test value: X^2= 4. Reject or Do not reject the null hypothesis 5. Summarize: Is there or is there not enough evidence to reject the claim?Is there or is there not enough evidence to support the claim?arrow_forwardMatch each step on the left with the procedure at that step on the right. Step Todo a, calculate p-value b. write conclusion V3 C. compare p-value to alpha 4 d. calculate test statistic e. identify test type and relevant statistic f. write claim symbolically g. write null and alternative hypotheses h. reject or fail to reject null Submit Question * Previous DEC étv 11 MacBook Aarrow_forwardHeights (cm) and weights (kg) are measured for 100 randomly selected adult males, and range from heights of 136 to 190 cm and weights of 39 to 150 kg. Let the predictor variable x be the first variable given. The 100 paired measurements yiel x= 167.51 cm, y = 81.36 kg,r= 0.232, P-value = 0.020, and y = - 103+ 1.13x. Find the best predicted value of y (weight) given an adult male who is 153 cm tall. Use a 0.01 significance level. The best predicted value of y for an adult male who is 153 cm tall is kg. (Round to two decimal places as needed.)arrow_forward
- Please help. State the hypothesis and identify the critical and z-values.arrow_forwardArm circumferences (cm) and heights (cm) are measured from randomly selected adult females. The 146pairs of measurements yield x=34.69cm, y=163.25cm, r=0.075, P-value=0.368, and y=157+0.1826x. Find the best predicted value of y (height) given an adult female with an arm circumference of 40.0cm. Let the predictor variable x be arm circumference and the response variable y be height. Use a 0.05 significance level. The best predicted value is ____cm.arrow_forwardA population of Emotional Quotient scores with μ = 38 and σ = 6 is standardized to create a new population with μ = 50 and σ = 10. Find the new score for a given original score or the old score for a given new score. original score new score X = 26 ? ? X = 65arrow_forward
- Match each step on the left with the procedure at that step on the right. Step Todo a. reject or fail to reject null b. write conclusion c. write claim symbolically d. calculate p-value e. write null and alternative hypotheses f. compare p-value to alpha g. identify test type and relevant statistic h. calculate test statistic ✓2 4 5 7 8arrow_forwardplease find the CRITICAL VALUE. x= x=arrow_forwardArm circumferences (cm) and heights (cm) are measured from randomly selected adult females. The 148 pairs of measurements yield x= 32.00 cm, y = 162.25 cm, r= 0.044, P-value = 0.596, and y = 159 +0.1111x. Find the best predicted value of y (height) given an adult female with an arm circumference of 32.0 cm. Let the predictor variable x be arm circumference and the response variable y be height. Use a 0.05 significance level. The best predicted value is cm. (Round to two decimal places as needed.)arrow_forward
- Match each Test Situation with the correct Critical Value. For a two-sided test, find only the positive value. Test Situation Critical Value v One sample, o is unknown, n = 32, H.:µ > Ho, and a = 0.10 a. 1.960 One sample, o is known, n = 100, Ha:u + po, and a = 0.06 b. 2.054 v One sample, o is unknown, n = 27, Ha: µ + lo, and a = 0.05 C. -3.090 v One sample, n = 150, Ha:p Hn, and a = 0.05 f. 2.056 g. 1.645 v One sample, n = 35, Ha:p + Po, and a = 0.05 h. 1.309 v One sample, n 15, Ha:p > Po, and a = 0.02 Submit Question O Type here to search op %23 24 & 3. Q E R tab s lock D G K C SIarrow_forwardArm circumferences (cm) and heights (cm) are measured from randomly selected adult females. The 143 pairs of measurements yield x = 32.40 cm, y = 160.39 cm, r=0.072, P-value = 0.393, and y = 157 + 0.1075x. Find the best predicted value of y (height) given an adult female with an arm circumference of 34.0 cm. Let the predictor variable x be arm circumference and the response variable y be height. Use a 0.05 significance level. %3D The best predicted value is cm. (Round to two decimal places as needed.) Enter your answer in the answer box. MacBook Pro 888 esc %24 % & 4. 9- E T. Y. H. K %#3arrow_forwardMatch each Test Situation with the correct Critical Value. For a two-sided test, find only the positive value. Test Situation Two samples, 1 = 25.3, I2 H.: P1 - 2 po, and a 0.01 %3D Two samples, n = 28, Ha: µd > 0, and a 0.01 dv One sample, ni = - 35, п2 41, Ha: p1 – p2 0, and a = 0.01 %3D %3D One sample of x's and y's, n = 114, Ha: p < 0, and a = 0.001 One sample, o is known, n = 68, Ha:µ # Ho, and a = 0.05 One sample, o is unknown, n = 76, H. : µ < Ho, and a 0.05 Critical Value a. 1.960 b. -3.165 C. 2.473 d. 2.326 e. 2.576 f. -1.294 g. -1.665 h. 2.426arrow_forward
 Algebra & Trigonometry with Analytic GeometryAlgebraISBN:9781133382119Author:SwokowskiPublisher:Cengage