
Concept explainers
Draw the
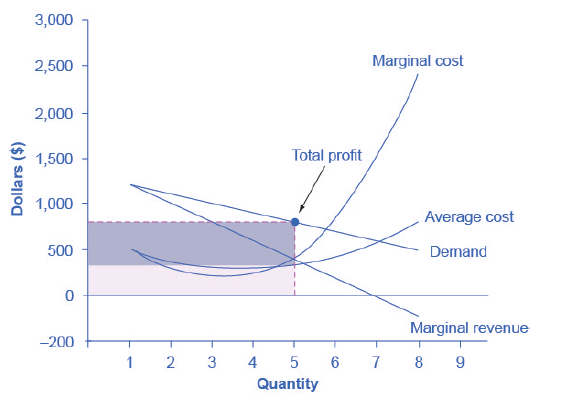
Figure 9.6 Illustrating Profits at the HealthPill Monolpoly

Trending nowThis is a popular solution!

Chapter 9 Solutions
Principles of Economics 2e
Additional Business Textbook Solutions
Financial Accounting (12th Edition) (What's New in Accounting)
Cost Accounting (15th Edition)
Construction Accounting And Financial Management (4th Edition)
Principles of Accounting Volume 2
Horngren's Accounting (11th Edition)


- The inverse demand curve a monopoly faces is -1/2 p= 20Q The firm's cost curve is C(Q) = 4Q. What is the profit-maximizing solution? (Round all numeric to two decimal places.) The profit-maximizing quantity is. The profit-maximizing price is $ What is the firm's economic profit? The firm earns a profit of $ . (Round your response to two decimal places.) 20 tv MacBook Air 80 DII F2 F3 F5 F7 F8 F9 F10 # 2$ & 2 з 4 6 7 W E R Y P S F G H J K > C V N nd command * 00 Barrow_forwardReview the graph at right. Monopoly 100- What is the unregulated monopoly price? $ (enter your response as a whole number) 90- MC What is the unregulated monopoly output? (enter your response as a whole 80 number) 70- P=$00 60- The total unregulated welfare (CS + PS) is $- (round your answer to the nearest penny) 50- 40 What is the optimal monopoly regulated price? $ (enter your response as a whole number) MCE$30 30- 20 The total regulated welfare (CS + PS) is $. (round your answer to the nearest penny) FQ=30 MR 50 60 70 80 90 100 Quantity 10 20 30 40 20 tv MacBook Air 80 DII DD F2 F3 F4 F6 F7 F8 F9 F10 F11 @ %23 2$ 2 3 4 8 { W E Y U P S D F G н J K > C V N M and command opti .. .- • V Barrow_forwardAn unregulated natural monopoly bottles Mt. McKinley air, unique clean air that has no substitutes. The monopoly's total fixed cost is $30,000 a year and its marginal cost is 10 cents a can. The graph illustrates the demand for Mt. McKinley air. Draw the average total cost curve. Plot the four control points at the quantities 100,000, 200,000, 300,000, and 400,000. Label the curve. Draw a point at the new quantity and price if the regulator sets a price cap such that the monopoly breaks even. The number of cans produced sold its marginal cost. A. is; benefit; exceeds B. is not; benefit; exceeds OC. is not; revenue; is greater than D. is; revenue; equals the efficient quantity because the marginal from the last can 60- 50- 40- 30- 20 20 10- Price (cents per can) 0- ATC MC D $300 100 200 300 400 Quantity (thousands of cans per year) >>> Draw only the objects specified in the question. 500arrow_forward
- An unregulated natural monopoly bottles Liquid Sunlight, a unique product with no substitutes. The monopoly's total fixed cost is $190,000 and its marginal cost is 30 cents a bottle. How many bottles of Liquid Sunlight does the monopoly sell and what is the price of a bottle of Liquid Sunlight? Is the monopoly's use of resources efficient? The graph shows the demand curve for Liquid Sunlight. Draw the marginal revenue curve. Label it MR. Draw the marginal cost curve. Label it MC. Draw a point at the monopoly's profit-maximizing quantity and price. 60 50- 40- 30- 20- 10- 0- Price and cost (cents per bottle) 0 D 0.5 1.5 2 Quantity (millions of bottles per year) >>> Draw only the objects specified in the question. 2.5arrow_forwardYou are the manager of a monopoly. If the marginal cost of your product is $100 and the price elasticity of demand for your product is 3, then the markup of price over marginal cost you should set is equal to. (Round your answer to one decimal place.) (Round your answer to one decimal place.) If the price elasticity of demand is 6 rather than 3, the markup you should set is equal to Use your knowledge of the factors that affect the magnitude of the price elasticity of demand to explain the difference in the markups in your answers to the last two parts. O A. A smaller price elasticity of demand suggests that your good is a normal good, which allows you to set a higher markup. OB. A smaller price elasticity of demand suggests that there are many substitutes for your good, which allows you to set a higher markup. OC. A smaller price elasticity of demand suggests that there are few substitutes for a good, which allows you to set a higher markup. D. A smaller price elasticity of demand…arrow_forwardReview the graph at right. Monopoly 100- What is the unregulated monopoly price? $ (enter your response as a whole number) MC 90- What area represents the consumer surplus for an unregulated monopolist? 80- 70- P= $60 60 What area represents the producer surplus for an unregulated monopolist? A, B, & C - What area represents the deadweight loss? 50- 40- D MC = $30 30- The welfare for the unregulated monopoly is V the welfare when optimal monopoly regulation is used. 20- 10- Q = 3OMR ó 10 20 30 40 50 60 70 80 90 100 Quantity 0- DEC dtv A 20 MacBook Air DII F11 F10 F4 F2 F3 & %23 %24 7 8. 3 4 { P Q W E R Y F G J K L A S D > C V M command option on command .. .- リ • V * COarrow_forward

 Economics: Private and Public Choice (MindTap Cou...EconomicsISBN:9781305506725Author:James D. Gwartney, Richard L. Stroup, Russell S. Sobel, David A. MacphersonPublisher:Cengage Learning
 Microeconomics: Private and Public Choice (MindTa...EconomicsISBN:9781305506893Author:James D. Gwartney, Richard L. Stroup, Russell S. Sobel, David A. MacphersonPublisher:Cengage Learning
 Managerial Economics: A Problem Solving ApproachEconomicsISBN:9781337106665Author:Luke M. Froeb, Brian T. McCann, Michael R. Ward, Mike ShorPublisher:Cengage Learning
 Economics (MindTap Course List)EconomicsISBN:9781337617383Author:Roger A. ArnoldPublisher:Cengage Learning