
Elementary Statistics: Picturing the World (7th Edition)
7th Edition
ISBN: 9780134683416
Author: Ron Larson, Betsy Farber
Publisher: PEARSON
expand_more
expand_more
format_list_bulleted
Concept explainers
Videos
Textbook Question
Chapter 9.3, Problem 22E
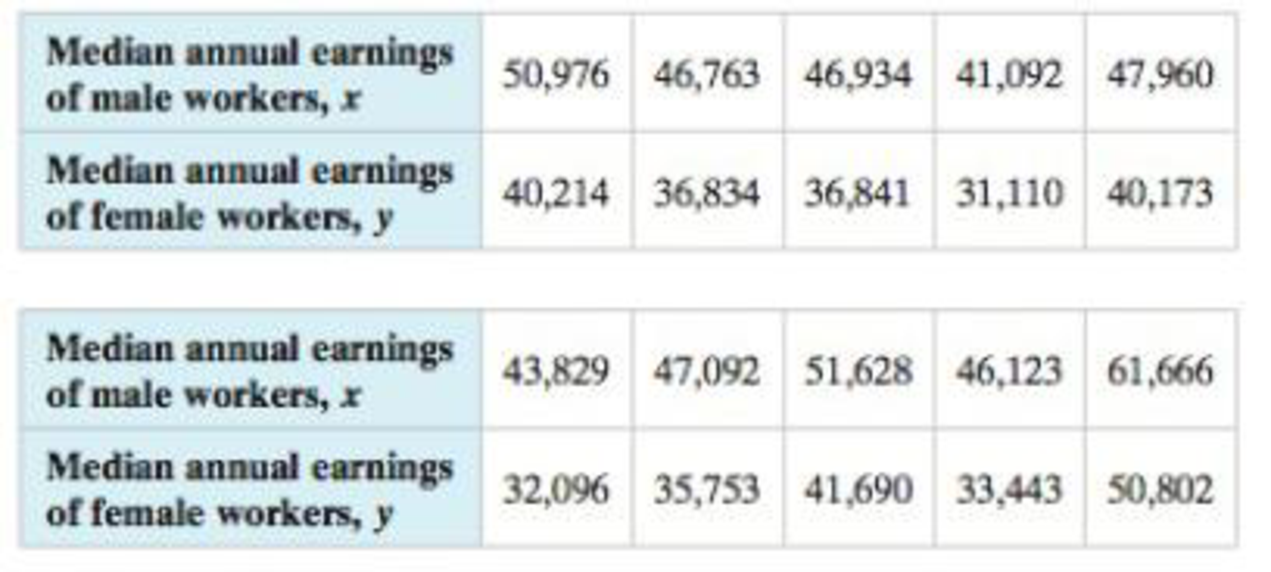
Constructing and Interpreting a Prediction Interval In Exercises 21–30, construct the indicated prediction interval and interpret the results.
22. Earnings of Women Construct a 95% prediction interval for the
12. Earnings of Men and Women The table shows the median annual earnings (in dollars) of male and female workers from 10 states in a recent year. The equation of the regression line is ŷ = 1.005x – 10,770.313. (Source. U.S. Census Bureau)
Expert Solution & Answer
Want to see the full answer?
Check out a sample textbook solution
Students have asked these similar questions
Regression and Predictions. Exercises 13–28 use the same data sets as Exercises 13–28 in Section 10-1. In each case, find the regression equation, letting the first variable be the predictor (x) variable. Find the indicated predicted value by following the prediction procedure summarized in Figure 10-5 on page 493.
Oscars Using the listed actress/actor ages, find the best predicted age of the Best Actor given that the age of the Best Actress is 54 years. Is the result reasonably close to the Best Actor’s (Eddie Redmayne) actual age of 33 years, which happened in 2015, when the Best Actress was Julianne Moore, who was 54 years of age?
Regression and Predictions. Exercises 13–28 use the same data sets as Exercises 13–28 in Section 10-1. In each case, find the regression equation, letting the first variable be the predictor (x) variable. Find the indicated predicted value by following the prediction procedure summarized in Figure 10-5 on page 493.
Tips Using the bill/tip data, find the best predicted tip amount for a dinner bill of $100. What tipping rule does the regression equation suggest?
Regression and Predictions. Exercises 13–28 use the same data sets as Exercises 13–28 in Section 10-1. In each case, find the regression equation, letting the first variable be the predictor (x) variable. Find the indicated predicted value by following the prediction procedure summarized in Figure 10-5 on page 493.
Internet and Nobel Laureates Find the best predicted Nobel Laureate rate for Japan, which has 79.1 Internet users per 100 people. How does it compare to Japan’s Nobel Laureate rate of 1.5 per 10 million people?
Chapter 9 Solutions
Elementary Statistics: Picturing the World (7th Edition)
Ch. 9.1 - A director of alumni affairs at a small college...Ch. 9.1 - A researcher conducts a study to determine whether...Ch. 9.1 - Consider the data on page 469 on the salaries and...Ch. 9.1 - Calculate the correlation coefficient for the...Ch. 9.1 - Use technology to calculate the correlation...Ch. 9.1 - In Try It Yourself 4, you calculated the...Ch. 9.1 - In Try It Yourself 5, you calculated the...Ch. 9.1 - Two variables have a positive linear correlation....Ch. 9.1 - Describe the range of values for the correlation...Ch. 9.1 - What does the sample correlation coefficient r...
Ch. 9.1 - Give examples of two variables that have perfect...Ch. 9.1 - Explain how to determine whether a sample...Ch. 9.1 - Discuss the difference between r and p.Ch. 9.1 - What are the null and alternate hypotheses for a...Ch. 9.1 - In your own words, what does it mean to say...Ch. 9.1 - Graphical Analysis In Exercises 912, determine...Ch. 9.1 - Graphical Analysis In Exercises 912, determine...Ch. 9.1 - Graphical Analysis In Exercises 912, determine...Ch. 9.1 - Graphical Analysis In Exercises 912, determine...Ch. 9.1 - In Exercises 13 and 14, identify the explanatory...Ch. 9.1 - In Exercises 13 and 14, identify the explanatory...Ch. 9.1 - Graphical Analysis In Exercises 1518, the scatter...Ch. 9.1 - Graphical Analysis In Exercises 1518, the scatter...Ch. 9.1 - Graphical Analysis In Exercises 1518, the scatter...Ch. 9.1 - Graphical Analysis In Exercises 1518, the scatter...Ch. 9.1 - In Exercises 1922, two variables are given that...Ch. 9.1 - In Exercises 1922, two variables are given that...Ch. 9.1 - In Exercises 1922, two variables are given that...Ch. 9.1 - In Exercises 1922, two variables are given that...Ch. 9.1 - Constructing a Scatter Plot and Determining...Ch. 9.1 - Constructing a Scatter Plot and Determining...Ch. 9.1 - Constructing a Scatter Plot and Determining...Ch. 9.1 - Constructing a Scatter Plot and Determining...Ch. 9.1 - Constructing a Scatter Plot and Determining...Ch. 9.1 - Constructing a Scatter Plot and Determining...Ch. 9.1 - In Exercise 23, add data for a child who is 6...Ch. 9.1 - In Exercise 24, remove the data for the girl who...Ch. 9.1 - In Exercise 25, remove the data for the...Ch. 9.1 - In Exercise 26, add data for an international...Ch. 9.1 - The t-Test for Correlation Coefficients In...Ch. 9.1 - The t-Test for Correlation Coefficients In...Ch. 9.1 - The t-Test for Correlation Coefficients In...Ch. 9.1 - The t-Test for Correlation Coefficients In...Ch. 9.1 - Interchanging x and y In Exercise 26, let the time...Ch. 9.1 - Generate a new data set. Using your knowledge of...Ch. 9.1 - Describe how to create a data set with a value of...Ch. 9.1 - Describe how to create a data set with a value of...Ch. 9.1 - Try to create a data set with a value of r that is...Ch. 9.2 - Find the equation of the regression line for the...Ch. 9.2 - Use technology to find the equation of the...Ch. 9.2 - The regression equation for the Old Faithful data...Ch. 9.2 - What is a residual? Explain when a residual is...Ch. 9.2 - Two variables have a positive linear correlation....Ch. 9.2 - Explain how to predict y-values using the equation...Ch. 9.2 - For a set of data and a corresponding regression...Ch. 9.2 - In order to predict y-values using the equation of...Ch. 9.2 - Why is it not appropriate to use a regression line...Ch. 9.2 - In Exercises 712, match the description in the...Ch. 9.2 - In Exercises 712, match the description in the...Ch. 9.2 - In Exercises 712, match the description in the...Ch. 9.2 - In Exercises 712, match the description in the...Ch. 9.2 - In Exercises 712, match the description in the...Ch. 9.2 - In Exercises 712, match the description in the...Ch. 9.2 - Graphical Analysis In Exercises 1316, match the...Ch. 9.2 - Graphical Analysis In Exercises 1316, match the...Ch. 9.2 - Graphical Analysis In Exercises 1316, match the...Ch. 9.2 - Graphical Analysis In Exercises 1316, match the...Ch. 9.2 - Finding the Equation of a Regression Line In...Ch. 9.2 - Finding the Equation of a Regression Line In...Ch. 9.2 - Finding the Equation of a Regression Line In...Ch. 9.2 - Finding the Equation of a Regression Line In...Ch. 9.2 - Finding the Equation of a Regression Line In...Ch. 9.2 - Finding the Equation of a Regression Line In...Ch. 9.2 - Finding the Equation of a Regression Line In...Ch. 9.2 - Finding the Equation of a Regression Line In...Ch. 9.2 - Finding the Equation of a Regression Line In...Ch. 9.2 - Finding the Equation of a Regression Line In...Ch. 9.2 - Registered Nurse Salaries In Exercises 2730, use...Ch. 9.2 - Registered Nurse Salaries In Exercises 2730, use...Ch. 9.2 - Registered Nurse Salaries In Exercises 2730, use...Ch. 9.2 - Registered Nurse Salaries In Exercises 2730, use...Ch. 9.2 - Interchanging X and y In Exercises 31 and 32,...Ch. 9.2 - Interchanging X and y In Exercises 31 and 32,...Ch. 9.2 - In Exercises 33 and 34, (a) find the equation of...Ch. 9.2 - In Exercises 33 and 34, (a) find the equation of...Ch. 9.2 - In Exercises 35 and 36, (a) construct a scatter...Ch. 9.2 - Prob. 36ECh. 9.2 - Prob. 37ECh. 9.2 - Prob. 38ECh. 9.2 - Prob. 39ECh. 9.2 - Prob. 40ECh. 9.2 - Prob. 41ECh. 9.2 - Prob. 42ECh. 9.2 - Prob. 43ECh. 9.2 - Prob. 44ECh. 9.2 - Prob. 45ECh. 9.2 - Prob. 46ECh. 9.2 - Prob. 47ECh. 9.2 - Prob. 48ECh. 9.2 - Prob. 1ACh. 9.2 - Prob. 2ACh. 9.2 - Prob. 3ACh. 9.2 - Prob. 4ACh. 9.3 - The correlation coefficient for the Old Faithful...Ch. 9.3 - Prob. 2TYCh. 9.3 - Using the results of Example 2, construct a 95%...Ch. 9.3 - Graphical Analysis In Exercises 13, use the...Ch. 9.3 - Graphical Analysis In Exercises 13, use the...Ch. 9.3 - Graphical Analysis In Exercises 13, use the...Ch. 9.3 - The coefficient of determination r2 is the ratio...Ch. 9.3 - What is the coefficient of determination for two...Ch. 9.3 - Two variables have a bivariate normal...Ch. 9.3 - In Exercises 710, use the value of the correlation...Ch. 9.3 - In Exercises 710, use the value of the correlation...Ch. 9.3 - In Exercises 710, use the value of the correlation...Ch. 9.3 - In Exercises 710, use the value of the correlation...Ch. 9.3 - Finding the Coefficient of Determination and the...Ch. 9.3 - Finding the Coefficient of Determination and the...Ch. 9.3 - Finding the Coefficient of Determination and the...Ch. 9.3 - Finding the Coefficient of Determination and the...Ch. 9.3 - Finding the Coefficient of Determination and the...Ch. 9.3 - Finding the Coefficient of Determination and the...Ch. 9.3 - Finding the Coefficient of Determination and the...Ch. 9.3 - Finding the Coefficient of Determination and the...Ch. 9.3 - Finding the Coefficient of Determination and the...Ch. 9.3 - Finding the Coefficient of Determination and the...Ch. 9.3 - Constructing and Interpreting a Prediction...Ch. 9.3 - Constructing and Interpreting a Prediction...Ch. 9.3 - Constructing and Interpreting a Prediction...Ch. 9.3 - Constructing and Interpreting a Prediction...Ch. 9.3 - STEM Employment and Mean Wage The table shows the...Ch. 9.3 - Constructing and Interpreting a Prediction...Ch. 9.3 - Constructing and Interpreting a Prediction...Ch. 9.3 - Fund Assets The table shows the total assets (in...Ch. 9.3 - New-Vehicle Sales The table shows the numbers of...Ch. 9.3 - New-Vehicle Sales The table shows the numbers of...Ch. 9.3 - Old Vehicles In Exercises 3134, use the figure...Ch. 9.3 - Old Vehicles In Exercises 3134, use the figure...Ch. 9.3 - Old Vehicles In Exercises 3134, use the figure...Ch. 9.3 - Old Vehicles In Exercises 3134, use the figure...Ch. 9.3 - Prob. 35ECh. 9.3 - Prob. 36ECh. 9.3 - Prob. 37ECh. 9.3 - In Exercises 37 and 38, construct the indicated...Ch. 9.4 - A statistics professor wants to determine how...Ch. 9.4 - Use the regression equation found in Try It...Ch. 9.4 - Predicting y-Values In Exercises 14, use the...Ch. 9.4 - Predicting y-Values In Exercises 14, use the...Ch. 9.4 - Prob. 3ECh. 9.4 - Predicting y-Values In Exercises 14, use the...Ch. 9.4 - Finding a Multiple Regression Equation In...Ch. 9.4 - Finding a Multiple Regression Equation In...Ch. 9.4 - In Exercises 7 and 8, calculate r2adi and...Ch. 9.4 - In Exercises 7 and 8, calculate r2adi and...Ch. 9 - In Exercises 14, (a) display the data in a scatter...Ch. 9 - In Exercises 14, (a) display the data in a scatter...Ch. 9 - In Exercises 14, (a) display the data in a scatter...Ch. 9 - In Exercises 14, (a) display the data in a scatter...Ch. 9 - Prob. 9.1.5RECh. 9 - Prob. 9.1.6RECh. 9 - Prob. 9.1.7RECh. 9 - Prob. 9.1.8RECh. 9 - In Exercises 912, find the equation of the...Ch. 9 - Prob. 9.2.10RECh. 9 - In Exercises 912, find the equation of the...Ch. 9 - Prob. 9.2.12RECh. 9 - In Exercises 1316, use the value of the...Ch. 9 - Prob. 9.3.14RECh. 9 - Prob. 9.3.15RECh. 9 - Prob. 9.3.16RECh. 9 - Prob. 9.3.17RECh. 9 - Prob. 9.3.18RECh. 9 - Prob. 9.3.19RECh. 9 - Prob. 9.3.20RECh. 9 - Prob. 9.3.21RECh. 9 - In Exercises 1924, construct the indicated...Ch. 9 - Prob. 9.3.23RECh. 9 - Prob. 9.3.24RECh. 9 - Prob. 9.4.25RECh. 9 - Prob. 9.4.26RECh. 9 - Prob. 9.4.27RECh. 9 - Prob. 9.4.28RECh. 9 - Prob. 1CQCh. 9 - For Exercises 18, use the data in the table, which...Ch. 9 - Prob. 3CQCh. 9 - Prob. 4CQCh. 9 - Prob. 5CQCh. 9 - Prob. 6CQCh. 9 - Prob. 7CQCh. 9 - For Exercises 18, use the data in the table, which...Ch. 9 - Prob. 9CQCh. 9 - Net Sales The equation used to predict the net...Ch. 9 - For Exercises 29, use the data in the table, which...Ch. 9 - For Exercises 29, use the data in the table, which...Ch. 9 - For Exercises 29, use the data in the table, which...Ch. 9 - For Exercises 29, use the data in the table, which...Ch. 9 - For Exercises 29, use the data in the table, which...Ch. 9 - For Exercises 29, use the data in the table, which...Ch. 9 - For Exercises 29, use the data in the table, which...Ch. 9 - For Exercises 29, use the data in the table, which...Ch. 9 - Analyzing the Data (a) The data in the table show...Ch. 9 - Making Predictions Construct a 95% prediction...Ch. 9 - Prob. 1TCh. 9 - Prob. 2TCh. 9 - Prob. 3TCh. 9 - Prob. 4TCh. 9 - Prob. 5TCh. 9 - Use technology to find the multiple regression...Ch. 9 - Prob. 7T
Knowledge Booster


Learn more about
Need a deep-dive on the concept behind this application? Look no further. Learn more about this topic, statistics and related others by exploring similar questions and additional content below.Similar questions
- Life Expectancy The following table shows the average life expectancy, in years, of a child born in the given year42 Life expectancy 2005 77.6 2007 78.1 2009 78.5 2011 78.7 2013 78.8 a. Find the equation of the regression line, and explain the meaning of its slope. b. Plot the data points and the regression line. c. Explain in practical terms the meaning of the slope of the regression line. d. Based on the trend of the regression line, what do you predict as the life expectancy of a child born in 2019? e. Based on the trend of the regression line, what do you predict as the life expectancy of a child born in 1580?2300arrow_forwardEXERCISES The following table gives the life expectancy at birth of females born in the United States in various years from 1970 to 2010. Source: National Center for Health Statistics. Year of Birth Life Expectancy years 1970 74.7 1975 76.6 1980 77.4 1985 78.2 1990 78.8 1995 78.9 2000 79.3 2005 79.9 2010 81.0 Find the life expectancy predicted by your regression equation for each year in the table, and subtract it from the actual value in the second column. This gives you a table of residuals. Plot your residuals as points on a graph.arrow_forwardInterpreting a Computer Display. In Exercises 5–8, we want to consider the correlation between heights of fathers and mothers and the heights of their sons. Refer to the StatCrunch display and answer the given questions or identify the indicated items. The display is based on Data Set 5 “Family Heights” in Appendix B. Height of Son Identify the multiple regression equation that expresses the height of a son in terms of the height of his father and mother.arrow_forward
- The table gives the average heights of children for ages 1 – 10, where x = the age (in years) and y = the height (in cm). Part a: Make a scatter plot and determine which type of model best fits the data.Part b: Find the regression equation.Part c: Can your equation be used to find the average height of a 20 year old? Explain.arrow_forwardRegression and Predictions. Exercises 13–28 use the same data sets as Exercises 13–28 in Section 10-1. In each case, find the regression equation, letting the first variable be the predictor (x) variable. Find the indicated predicted value by following the prediction procedure summarized in Figure 10-5 on page 493. CPI and the Subway Use the CPI/subway fare data from the preceding exercise and find the best predicted subway fare for a time when the CPI reaches 500. What is wrong with this prediction?arrow_forwardRegression and Predictions. Exercises 13–28 use the same data sets as Exercises 13–28 in Section 10-1. In each case, find the regression equation, letting the first variable be the predictor (x) variable. Find the indicated predicted value by following the prediction procedure summarized in Figure 10-5 on page 493. Crickets and Temperature Find the best predicted temperature at a time when a cricket chirps 3000 times in 1 minute. What is wrong with this predicted temperature?arrow_forward
- Making Predictions. In Exercises 5–8, let the predictor variable x be the first variable given. Use the given data to find the regression equation and the best predicted value of the response variable. Be sure to follow the prediction procedure summarized in Figure 10-5 on page 493. Use a 0.05 significance level. Bear Measurements Head widths (in.) and weights (lb) were measured for 20 randomly selected bears (from Data Set 9 “Bear Measurements” in Appendix B). The 20 pairs of measurements yield x = 6.9 in., ȳ = 214.3 lb, r = 0.879, P -value = 0.000, and ŷ = −212 + 61.9x. Find the best predicted value of ŷ (weight) given a bear with a head width of 6.5 in.arrow_forwardApplying the Concepts and SkillsIn Exercises, we repeat the information from Exercises. For each exercise here, discuss what satisfying Assumptions 1–3 for regression inferences by the variables under consideration would mean.ExercisesApplying the Concepts and SkillsIn each of Exercises,a. find the regression equation for the data points.b. graph the regression equation and the data points.c. describe the apparent relationship between the two variables under consideration.d. interpret the slope of the regression line.e. identify the predictor and response variables.f. identify outliers and potential influential observations.g. predict the values of the response variable for the specified values of the predictor variable, and interpret your results.Tax Efficiency.Tax efficiency is a measure, ranging from 0 to 100, of how much tax due to capital gains stock or mutual funds investors pay on their investments each year; the higher the tax efficiency, the lower is the tax. In the article…arrow_forward-Using the data in Table 6–11, answer the following: What is the slope? What is the intercept? Write the regression equation. Calculate a regression forecast for month 25.arrow_forward
- Sam Jones has 2 years of historical sales data for his company. He is applyingfor a business loan and must supply his projections of sales by month for thenext 2 years to the bank. a. Using the data from Table 6–12, provide a regression forecast for timeperiods 25 through 48.b. Does Sam’s sales data show a seasonal pattern?arrow_forwarda. Write out the estimated linear regression equation. b. What is the estimated expected weight of an alligator that has snout Length=36 inches?arrow_forwardBirthrates 2009 The table shows the number of livebirths per 1000 women aged 15–44 years in the United States, starting in 1965. (National Center for Health Sta-tistics, www.cdc.gov/nchs/) a) Make a scatterplot and describe the general trend in Birth-rates. (Enter Year as years since 1900: 65, 70, 75, etc.) b) Find the equation of the regression line.c) Check to see if the line is an appropriate model. Explain.d) Interpret the slope of the line.e) The table gives rates only at 5-year intervals. Estimatewhat the rate was in 1978.f) In 1978, the birthrate was actually 15.0. How close didyour model come?g) Predict what the Birthrate will be in 2010. Commenton your faith in this prediction.h) Predict the Birthrate for 2025. Comment on your faithin this prediction.arrow_forward
arrow_back_ios
SEE MORE QUESTIONS
arrow_forward_ios
Recommended textbooks for you
 Calculus For The Life SciencesCalculusISBN:9780321964038Author:GREENWELL, Raymond N., RITCHEY, Nathan P., Lial, Margaret L.Publisher:Pearson Addison Wesley,
 Functions and Change: A Modeling Approach to Coll...AlgebraISBN:9781337111348Author:Bruce Crauder, Benny Evans, Alan NoellPublisher:Cengage Learning
 Algebra & Trigonometry with Analytic GeometryAlgebraISBN:9781133382119Author:SwokowskiPublisher:Cengage
 Big Ideas Math A Bridge To Success Algebra 1: Stu...AlgebraISBN:9781680331141Author:HOUGHTON MIFFLIN HARCOURTPublisher:Houghton Mifflin Harcourt
Calculus For The Life Sciences
Calculus
ISBN:9780321964038
Author:GREENWELL, Raymond N., RITCHEY, Nathan P., Lial, Margaret L.
Publisher:Pearson Addison Wesley,
Functions and Change: A Modeling Approach to Coll...
Algebra
ISBN:9781337111348
Author:Bruce Crauder, Benny Evans, Alan Noell
Publisher:Cengage Learning
Algebra & Trigonometry with Analytic Geometry
Algebra
ISBN:9781133382119
Author:Swokowski
Publisher:Cengage
Big Ideas Math A Bridge To Success Algebra 1: Stu...
Algebra
ISBN:9781680331141
Author:HOUGHTON MIFFLIN HARCOURT
Publisher:Houghton Mifflin Harcourt
Correlation Vs Regression: Difference Between them with definition & Comparison Chart; Author: Key Differences;https://www.youtube.com/watch?v=Ou2QGSJVd0U;License: Standard YouTube License, CC-BY
Correlation and Regression: Concepts with Illustrative examples; Author: LEARN & APPLY : Lean and Six Sigma;https://www.youtube.com/watch?v=xTpHD5WLuoA;License: Standard YouTube License, CC-BY