
Horngren's Cost Accounting: A Managerial Emphasis (16th Edition)
16th Edition
ISBN: 9780134475585
Author: Srikant M. Datar, Madhav V. Rajan
Publisher: PEARSON
expand_more
expand_more
format_list_bulleted
Concept explainers
Videos
Textbook Question
Chapter 10, Problem 10.24E
Matching graphs with descriptions of cost and revenue behavior. (D. Green, adapted) Given here are a number of graphs.
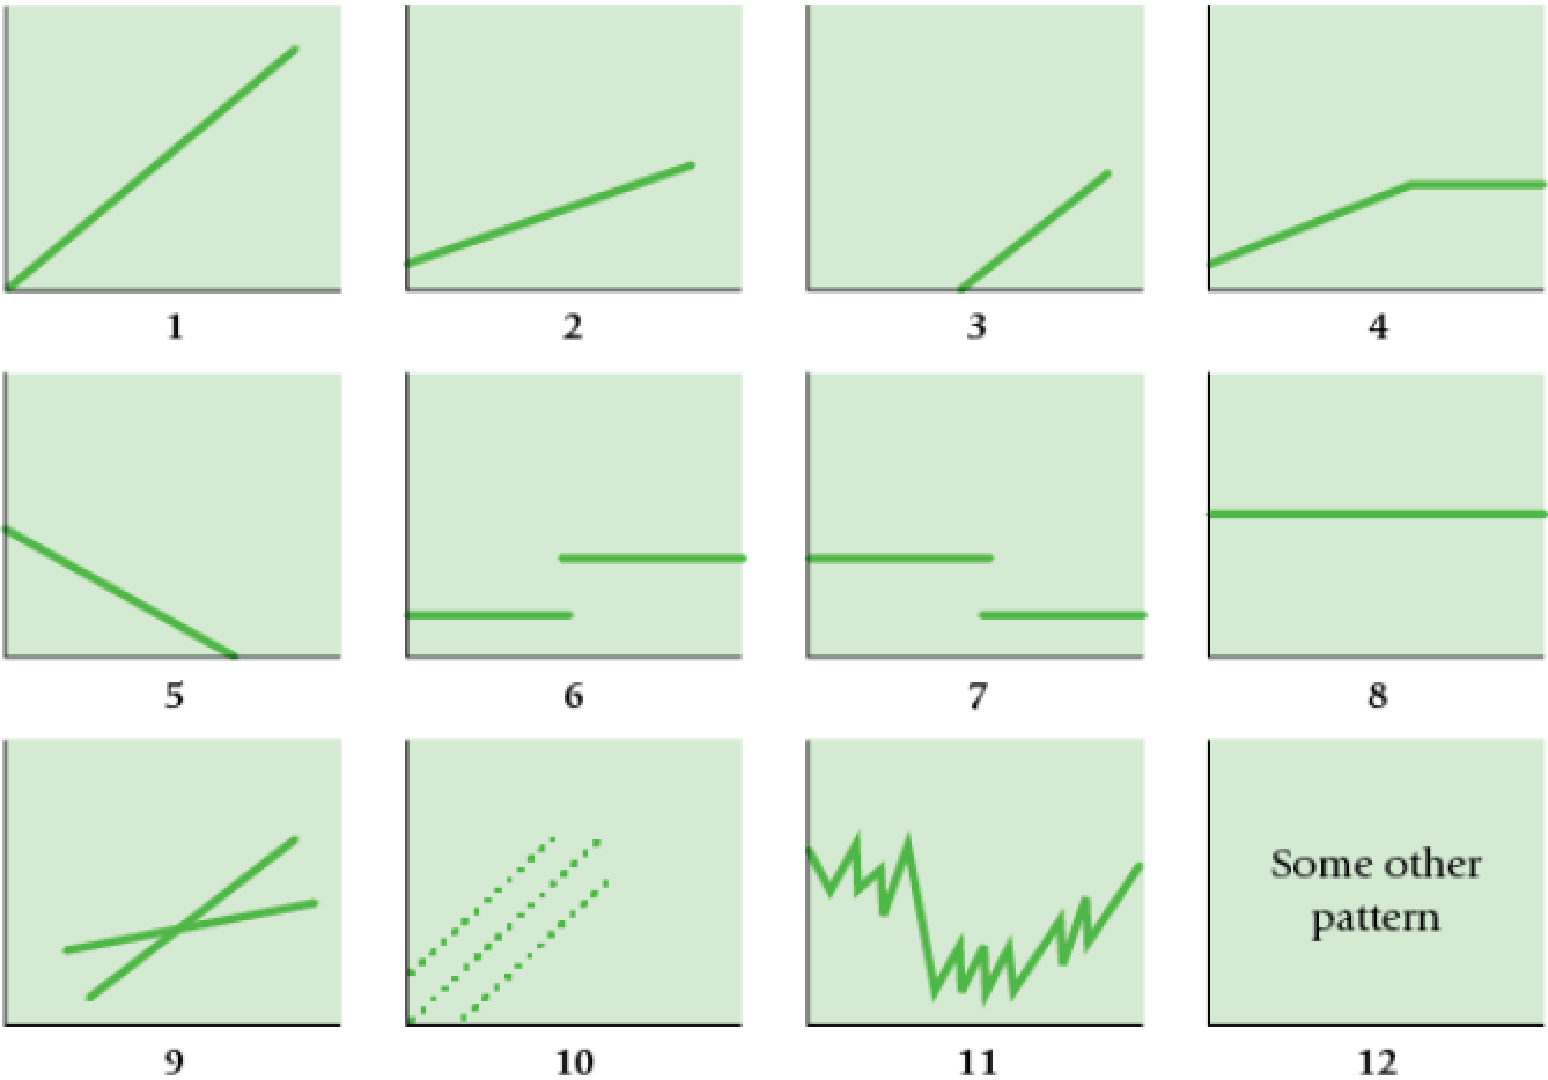
The horizontal axis of each graph represents the units produced over the year, and the vertical axis represents total cost or revenues.
Indicate by number which graph best fits the situation or item described (a–h). Some graphs may be used more than once; some may not apply to any of the situations.
Required
- a. Direct material costs
- b. Supervisors’ salaries for one shift and two shifts
- c. A cost–volume–profit graph
- d. Mixed costs—for example, car rental fixed charge plus a rate per mile driven
- e.
Depreciation of plant, computed on a straight-line basis - f. Data supporting the use of a variable-cost rate, such as
manufacturing labor cost of $14 per unit produced - g. Incentive bonus plan that pays managers $0.10 for every unit produced above some level of production
- h. Interest expense on $2 million borrowed at a fixed rate of interest
Expert Solution & Answer

Learn your wayIncludes step-by-step video

schedule11:39
Students have asked these similar questions
Atlanta Systems produces two different products, Product A, which sells for $450 per unit, and Product B, which sells for $800 per
unit, using three different activities: Design, which uses Engineering Hours as an activity driver; Machining, which uses machine hours
as an activity driver; and Inspection, which uses number of batches as an activity driver. The cost of each activity and usage of the
activity drivers are as follows:
Usage by
Product A
Usage by
Product B
Cost
Design (Engineering Hours)
Machining (Machine Hours)
Inspection (Batches)
$ 190,000
$1,800,000
$
108
142
2,160
2,840
160,000
42
38
8
Atlanta manufactures 12,500 units of Product A and 10,200 units of Product B per month. Each unit of Product A uses $100 of direct
materials and $45 of direct labor, while each unit of Product B uşes $140 of direct materials and $75 of direct labor.
What formula do we use in accounting to determine estimated total manufacturing overhead (MOH)?
Group of answer choices
Y= mX +b
Y = a + bX
(Estimated Total MOH/(Estimated Total Cost Driver)
(Actual Total MOH)/(Actual Total Cost Driver)
(Estimated Total MOHV(Actual Total Cost Driver)
What formula do we use in accounting to determine estimated total manufacturing overhead (MOH)?
Group of answer choices
Y = mX +b
Y = a+ bX
(Estimated Total MOH/(Estimated Total Cost Driver)
(Actual Total MOH)/(Actual Total Cost Driver)
(Estimated Total MOH/(Actual Total Cost Driver)
Chapter 10 Solutions
Horngren's Cost Accounting: A Managerial Emphasis (16th Edition)
Ch. 10 - What two assumptions are frequently made when...Ch. 10 - Describe three alternative linear cost functions.Ch. 10 - What is the difference between a linear and a...Ch. 10 - High correlation between two variables means that...Ch. 10 - Name four approaches to estimating a cost...Ch. 10 - Describe the conference method for estimating a...Ch. 10 - Describe the account analysis method for...Ch. 10 - List the six steps in estimating a cost function...Ch. 10 - When using the high-low method, should you base...Ch. 10 - Describe three criteria for evaluating cost...
Ch. 10 - Define learning curve. Outline two models that can...Ch. 10 - Discuss four frequently encountered problems when...Ch. 10 - Prob. 10.13QCh. 10 - All the independent variables in a cost function...Ch. 10 - Multicollinearity exists when the dependent...Ch. 10 - HL Co. uses the high-low method to derive a total...Ch. 10 - A firm uses simple linear regression to forecast...Ch. 10 - In regression analysis, the coefficient of...Ch. 10 - A regression equation is set up, where the...Ch. 10 - What would be the approximate value of the...Ch. 10 - Estimating a cost function. The controller of the...Ch. 10 - Identifying variable-, fixed-, and mixed-cost...Ch. 10 - Various cost-behavior patterns. (CPA, adapted)....Ch. 10 - Matching graphs with descriptions of cost and...Ch. 10 - Account analysis, high-low. Stein Corporation...Ch. 10 - Account analysis method. Gower, Inc., a...Ch. 10 - Prob. 10.27ECh. 10 - Estimating a cost function, high-low method. Lacy...Ch. 10 - Linear cost approximation. Dr. Young, of Young and...Ch. 10 - Cost-volume-profit and regression analysis....Ch. 10 - Regression analysis, service company. (CMA,...Ch. 10 - High-low, regression. May Blackwell is the new...Ch. 10 - Learning curve, cumulative average-time learning...Ch. 10 - Learning curve, incremental unit-time learning...Ch. 10 - High-low method. Wayne Mueller financial analyst...Ch. 10 - High-low method and regression analysis. Market...Ch. 10 - High-low method; regression analysis. (CIMA,...Ch. 10 - Regression, activity-based costing, choosing cost...Ch. 10 - Interpreting regression results. Spirit...Ch. 10 - Cost estimation, cumulative average-time learning...Ch. 10 - Cost estimation, incremental unit-time learning...Ch. 10 - Regression; choosing among models. Apollo Hospital...Ch. 10 - Multiple regression (continuation of 10-42). After...Ch. 10 - Cost estimation. Hankuk Electronics started...Ch. 10 - Prob. 10.45PCh. 10 - Interpreting regression results, matching time...Ch. 10 - Purchasing department cost drivers, activity-based...Ch. 10 - Purchasing department cost drivers, multiple...
Additional Business Textbook Solutions
Find more solutions based on key concepts
What can a company do to reduce its workers' compensation insurance costs?
Construction Accounting And Financial Management (4th Edition)
Use the following excerpts from the year-end Adjusted Trial Balance to prepare the four journal entries require...
Principles of Accounting Volume 1
Discussion Questions 1. What characteristics of the product or manufacturing process would lead a company to us...
Managerial Accounting (4th Edition)
FIFO, Perpetual Basis. Spider incorporated provided the following information regarding its inventory for the c...
Intermediate Accounting (2nd Edition)
(Record inventory transactions in the periodic system) Wexton Technologies began the year with inventory of 560...
Financial Accounting (11th Edition)
Knowledge Booster


Learn more about
Need a deep-dive on the concept behind this application? Look no further. Learn more about this topic, accounting and related others by exploring similar questions and additional content below.Similar questions
- Scattergraph method Using the data in P4-2 and a piece of graph paper: 1. Plot the data points on the graph and draw a line by visual inspection, indicating the trend shown by the data points. 2. Determine the variable cost per unit and the total fixed cost from the information on the graph. 3. Determine the variable cost to be charged to the product for the year. 4. Determine the fixed cost to be charged to factory overhead for the year. 5. Do these answers agree with the answers to P4-2? Why or why not?arrow_forwardClassify each of the following as a variable, fixed cost or mixed cost. a. Direct labour b. Depreciation of machinery c. Factory rental d. Factory managers salary e. Commissions paid to sales personnel f. Salaries of sales clerks g. Maintenance for production equipment based on production volume h. Telephone chargesarrow_forwardUsing absorption costing:(i) Calculate the production cost per unit. (ii) Prepare an income statement for the year.arrow_forward
- Kindly answer all questions: 1.) Cost behavior is considered linear whenever a straight line is a reasonable approximation for the relation between cost and activity. A. True B. False 2.) Which of the following is an example of a cost that is variable with respect to the number of units produced? A. rent on administrative office building B. rent on factory building C. Salaries of top marketing executives D. direct labor cost, where the direct labor force is adjusted to actual production of the period 3.) Fixed costs are constant in total amount over the relevant range of operations. A. True B. False 4.) The cost function derived by the simple least squares method: A. must be tested for minimum and maximum points. B. is parabolic. C. is linear. D. is curvilinear.arrow_forwardPlease answer the following: 1. What is cost of production report? 2. What is cost per equivalent unit? 3. What is Equivalent Unit of Production? 4. What is FIFO method? 5. what is Average cost method?arrow_forwardRequired: For each cost item, indicate whether it would be variable or fixed with respect to the number of units produced and sold; and then whether it would be a selling cost, an administrative cost, or a manufacturing cost. If it is a manufacturing cost, indicate whether it is a direct cost or an indirect cost with respect to units of product. Three sample answers are provided for illustration. Cost Item Example: Direct labor Example: Executive salaries Example: Factory rent 1. Property taxes, factory. 2. Boxes used for packaging detergent produced by the company. 3. Salespersons' commissions. 4. Supervisor's salary, factory. 5. Depreciation, executive autos. 6. Wages of workers assembling computers. 7. Insurance, finished goods warehouses. 8. Lubricants for production equipment. 9. Advertising costs. 10. Microchips used in producing calculators. 11. Shipping costs on merchandise sold. 12. Magazine subscriptions, factory lunchroom. 13. Thread in a garment factory. 14. Executive life…arrow_forward
- Please refer the queations to the images attached. Thank you. Required: Compute equivalent units of production. Prepare the cost of production. Round total costs to the nearest peso.arrow_forwardThe accompanying figures depict a number of cost behavior patterns that might be found in a company's cost structure. The vertical axis on each graph represents total cost, and the horizontal axis on each graph represents level of activity (volume). For each of the given situations, identify the graph that illustrates the cost pattern involved. Any graph may be used more than once. (Adapted originally from the CPA exam; also found in R.H. Garrison and E.W. Noreen, Managerial Acco11111ing, 9th edition, Irwin, 2009.)(a) Electricity bill-a flat-rate fixed charge plus a variable cost after a certainnumber of kilowatt-hours are used.(b) City water bill, which is computed as follows:First 1,000,000 gallons $1,000 flat, or lessNext 10,000 gallons $0.003 per gallon usedNext 10,000 gallons $0.006 per gallon usedNext 10,000 gallons $0.009 per gallon used(c) Depreciation of equipment, where the amount is computed…arrow_forwardSelect the graph (A through L) that best matches the numbered (1 through 7) italicized descriptions of various cost behavior. For each graph, the vertical (y) axis represents total dollars of cost,and the horizontal (x) axis represents output units during the period. The graphs may be usedmore than once.1. The cost of depreciation. The asset being depreciated is a large piece of production machinery equipment where the straight-line depreciation method is used.letter ______2. The cost of operating a forklift. The forklift is used to move work-in-process inventory ingroups of 100 units across the factory floor.letter ______3. The cost of direct materials. The first 2,000 pounds of direct materials are free because theyare donated by the local city government. After that, the direct materials cost consists of aper-unit amount that decreases after a threshold of 2,500 total pounds is reached.letter ______4. The cost of inspecting finished goods inventory. Each unit is inspected by a…arrow_forward
- Using the data in P4-2 and Microsoft Excel: 1. Separate the variable and fixed elements. 2. Determine the cost to be charged to the product for the year. 3. Determine the cost to be charged to factory overhead for the year. 4. Determine the plotted data points using Chart Wizard. 5. Determine R2. 6. How do these solutions compare to the solutions in P4-2 and P4-3? 7. What does R2 tell you about this cost model?arrow_forwardMatching Cost Behavior Descriptions to Cost Behavior Graphs Select the graph (A through L) that best matches the numbered (1 through 7) italicized descriptions of various cost behavior. For each graph, the vertical (y) axis represents total dollars of cost, and the horizontal (x) axis represents output units during the period. The graphs may be used more than once. 1. The cost of depreciation. The asset being depreciated is a large piece of production machinery equipment where the straight-line depreciation method is used. letter _________ 2. The cost of operating a forklift. The forklift is used to move work-in-process inventory in groups of 100 units across the factory floor. letter _________ 3. The cost of direct materials. The first 2,000 pounds of direct materials are free because they are donated by the local city government. After that, the direct materials cost consists of a per-unit amount that decreases after a threshold of 2,500 total pounds is reached. letter _________ 4. The cost of inspecting finished goods inventory. Each unit is inspected by a quality expert who is paid the same amount for each unit inspected. letter _________ 5. The cost of product shipping for all output shipped in the period. The shipping cost per unit decreases with each unit shipped up to a certain number of units, at which time the shipping cost per unit remains constant. letter _________ 6. The cost of compliance with Environmental Protection Agency (EPA) regulations. An electric car plant manufactures car batteries. Part of the manufacturing process involves the emission of toxic chemicals into the environment, which is regulated by the EPA in the form of a fee assessed on a per-unit manufactured basis. The per-unit cost of complying with these regulations increases with every fifth battery produced. letter ______ 7. The cost of customer energy consumption. The local electric utility company uses a pricing system designed to encourage customers to conserve energy usage. Therefore, the rate per kilowatt-hour that is charged to customers increases with each hour the customer consumes. letter _______arrow_forwardAccumulating costs means that a. costs must be summed and entered on the income statement. b. each cost must be linked to some cost object. c. costs must be measured and tracked. d. costs must be allocated to units of production. e. costs have expired and must be transferred from the balance sheet to the income statement.arrow_forward
arrow_back_ios
SEE MORE QUESTIONS
arrow_forward_ios
Recommended textbooks for you
 Principles of Cost AccountingAccountingISBN:9781305087408Author:Edward J. Vanderbeck, Maria R. MitchellPublisher:Cengage Learning
 Managerial Accounting: The Cornerstone of Busines...AccountingISBN:9781337115773Author:Maryanne M. Mowen, Don R. Hansen, Dan L. HeitgerPublisher:Cengage Learning
 Managerial AccountingAccountingISBN:9781337912020Author:Carl Warren, Ph.d. Cma William B. TaylerPublisher:South-Western College Pub
 Excel Applications for Accounting PrinciplesAccountingISBN:9781111581565Author:Gaylord N. SmithPublisher:Cengage Learning
 Cornerstones of Cost Management (Cornerstones Ser...AccountingISBN:9781305970663Author:Don R. Hansen, Maryanne M. MowenPublisher:Cengage Learning
 Principles of Accounting Volume 2AccountingISBN:9781947172609Author:OpenStaxPublisher:OpenStax College
Principles of Cost Accounting
Accounting
ISBN:9781305087408
Author:Edward J. Vanderbeck, Maria R. Mitchell
Publisher:Cengage Learning
Managerial Accounting: The Cornerstone of Busines...
Accounting
ISBN:9781337115773
Author:Maryanne M. Mowen, Don R. Hansen, Dan L. Heitger
Publisher:Cengage Learning
Managerial Accounting
Accounting
ISBN:9781337912020
Author:Carl Warren, Ph.d. Cma William B. Tayler
Publisher:South-Western College Pub
Excel Applications for Accounting Principles
Accounting
ISBN:9781111581565
Author:Gaylord N. Smith
Publisher:Cengage Learning
Cornerstones of Cost Management (Cornerstones Ser...
Accounting
ISBN:9781305970663
Author:Don R. Hansen, Maryanne M. Mowen
Publisher:Cengage Learning
Principles of Accounting Volume 2
Accounting
ISBN:9781947172609
Author:OpenStax
Publisher:OpenStax College
Responsibility Accounting| Responsibility Centers and Segments| US CMA Part 1| US CMA course; Master Budget and Responsibility Accounting-Intro to Managerial Accounting- Su. 2013-Prof. Gershberg; Author: Mera Skill; Rutgers Accounting Web;https://www.youtube.com/watch?v=SYQ4u1BP24g;License: Standard YouTube License, CC-BY