
Videos
Lobster fishing study. Refer to the Bulletin of Marine Science (April 2010) study of teams of fishermen fishing for the red spiny lobster in Baja California Sur, Mexico, Exercise 2.126 (p. 107). Two variables measured for each of 15 teams from two fishing cooperatives were y = total catch of lobsters (in kilograms) during the season and x = average percentage of traps allocated per day to exploring areas of unknown catch (called search frequency). These data are listed in the table.
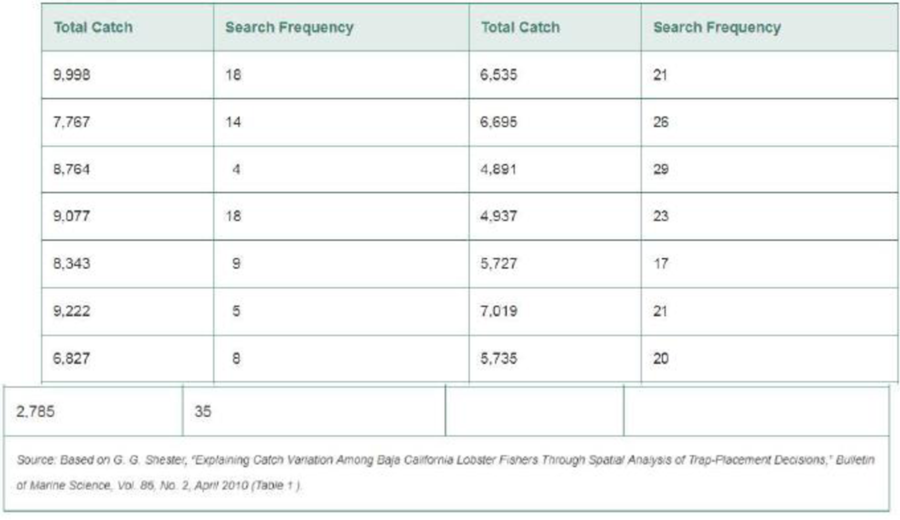
a. Graph the data in a
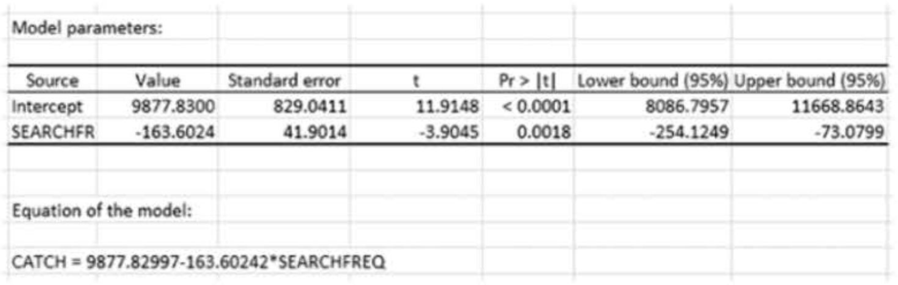
b. A simple linear regression analysis was conducted using XLSTAT. A portion of the regression printout is shown below. Find the estimates of β0 and β1 on the printout.
c. If possible, give a practical interpretation of the estimate of β0. If no practical interpretation is possible, explain why.
d. If possible, give a practical interpretation of the estimate of β1. If no practical interpretation is possible, explain why.
XLSTAT output for Exercise 11.2
Want to see the full answer?
Check out a sample textbook solution
Chapter 11 Solutions
Statistics for Business and Economics (13th Edition)


 Functions and Change: A Modeling Approach to Coll...AlgebraISBN:9781337111348Author:Bruce Crauder, Benny Evans, Alan NoellPublisher:Cengage Learning
 Linear Algebra: A Modern IntroductionAlgebraISBN:9781285463247Author:David PoolePublisher:Cengage Learning
 Calculus For The Life SciencesCalculusISBN:9780321964038Author:GREENWELL, Raymond N., RITCHEY, Nathan P., Lial, Margaret L.Publisher:Pearson Addison Wesley,
 Glencoe Algebra 1, Student Edition, 9780079039897...AlgebraISBN:9780079039897Author:CarterPublisher:McGraw Hill
 Big Ideas Math A Bridge To Success Algebra 1: Stu...AlgebraISBN:9781680331141Author:HOUGHTON MIFFLIN HARCOURTPublisher:Houghton Mifflin Harcourt