
Concept explainers
Videos
Hemmingway, Inc. is considering a $5 million research and development (R&D) project. Profit projections appear promising, but Hemmingway’s president is concerned because the
The decision tree follows. The profit projection for each outcome is shown at the end of the branches. For example, the revenue projection for the high demand outcome is $59 million. However, the cost of the R&D project ($5 million) and the cost of the production facility ($20 million) show the profit of this outcome to be $59 – $5 – $20 = $34 million. Branch probabilities are also shown for the chance
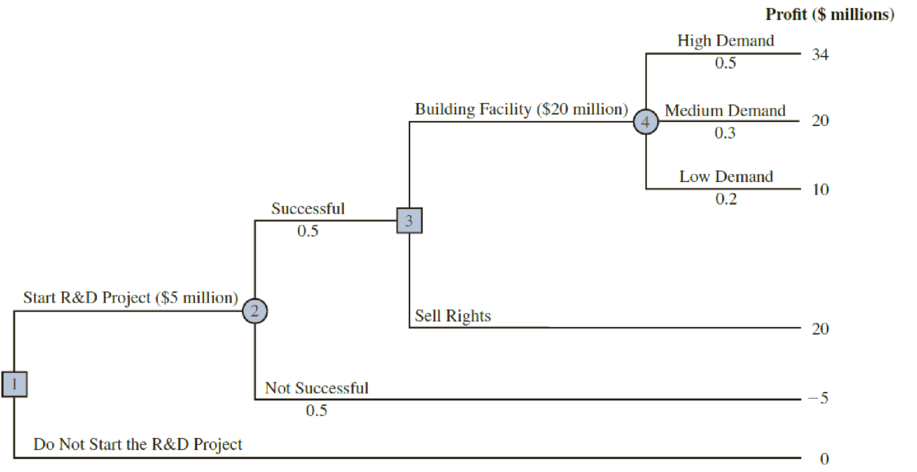
- a. Analyze the decision tree to determine whether the company should undertake the R&D project. If it does, and if the R&D project is successful, what should the company do? What is the expected value of your strategy?
- b. What must the selling price be for the company to consider selling the rights to the product?
- c. Develop a risk profile for the optimal strategy.
Want to see the full answer?
Check out a sample textbook solution
Chapter 15 Solutions
Essentials of Business Analytics (MindTap Course List)


- The owner of a small firm has just purchased a personal computer, which she expects will serve her for the next two years. The owner has been told that she "must buy a surge suppressor to provide protection for her new hardware against possible surges or variations in the electrical current, which have the capacity to damage the computer. The amount of damage to the computer depends on the strength of the surge. It has been estimated that there is a 3% chance of incurring 450 dollar damage, 4% chance of incurring 250 dollar damage, and 15% chance of 75 dollar damage. An inexpensive suppressor, which would provide protection for only one surge, can be purchased. How much should the owner be willing to pay if she makes decisions on the basis of expected value? Expected Value =arrow_forwardA Statistics professor has observed that for several years students score an average of 112 points out of 150 on the semester exam. A salesman suggests that he try a statistics software package that gets students more involved with computers, predicting that it will increase students' scores. The software is expensive, and the salesman offers to let the professor use it for a semester to see if the scores on the final exam increase significantly. The professor will have to pay for the software only if he chooses to continue using it. In the trial course that used this software, 249 students scored an average of 114 points on the final with a standard deviation of 8.4 points. Complete parts a) and b) below. A. Fail to reject Ho. The change is not statistically significant. The software does not appear to improve exam scores. B. Fail to reject Ho. The change is statistically significant. The software does appear to improve exam scores. C. Reject Ho. The change is not statistically…arrow_forwardA person wants to earn the profit of $200,000 from his three goods next year. Product A gives him a profit of $100 and has an expected growth of 10% per year. Product B provides a profit of $200 and has an expected growth of 5% per year. Product C provides a profit of $150 and has an expected growth of 8% per year. The person plans to sell two times of product C as of product B. If the person estimated a total growth of 12% per year in his profits, how many of each product should the person sell in a year? the answer is A: 1931, B: 14, C: 28arrow_forward
- The Harriet Hotel in downtown Boston has 100 rooms that rent for $150 per night. It costs the hotel $30 per room in variable costs (cleaning, bathroom items, etc.) each night a room is occupied. For each reservation accepted, there is a 5% chance that the guest will not arrive. If the hotel overbooks, it costs $200 to compensate guests whose reservations cannot be honored. How many reservations should the hotel accept if it wants to maximize the average daily profit?arrow_forwardA citrus grower anticipates a profit of $100,000 this year if the nightly temperatures remain mild. Unfortunately, the weather forecast indicates a 25% chance that the temperatures will drop below freezing during the next week. Such freezing weather will destroy 40% of the crop and reduce the profit to $60,000. However, the grower can protect the citrus fruit against the possible freezing (using smudge pots, electric fans, and so on) at a cost of $5000. Should the grower spend the $5000 and thereby reducethe profit to $95,000? [Hint: Compute E(X ), where X is theprofit the grower will get if he does nothing to protect the fruit.]arrow_forwardWhile the stock and bond markets can be risky in the short run, time has a moderating effect on market risk. The longer you hold a stock or bond investment, the lower your chances of losing money, and the greater the odds of earning a return close to the long-term average. For example, a one-year investment in stocks has historically produced returns ranging from +53.9% to -43.3%. Over ten-year periods, however, returns have varied from -0.9% per year for the worst ten years to +20.1% per year for the best ten years. Holding Period Best Return Worst Return 1 Year +53.9% -43.3% 5 Years +23.9% -12.5% 10 Years +20.1% -0.9% 15 Years +18.2% +0.6% 20 Years +16.9% +3.1% 25 Years +14.7% +5.9% As you can see, risk can be substantial over short periods. But over longer horizons, the chance of losing money is substantially reduced. The same principle applies to bonds, though bonds are less risky than stocks. For long-term bonds, it takes ten years before returns are consistently…arrow_forward
- Two pumps capable of delivering 100 hp to an agricultural application are being evaluated in a present economy study. The selected pump will only be utilized for one year, and it will have no market value at the end of the year. Pertinent data are summarized as given follows. If electric power costs $0.10 per kWh and the pump will be operated 4,000 hours per year, which pump should be chosen? Recall that 1 hp = 0.746 kW.arrow_forwardThe owner of a small firm has just purchased a personal computer, which she expects will serve her for the next two years. The owner has been told that she "must" buy a surge suppressor to provide protection for her new hardware against possible surges or variations in the electrical current, which have the capacity to damage the computer. The amount of damage to the computer depends on the strength of the surge. It has been estimated that there is a 1% chance of incurring 300 dollar damage, 4% chance of incurring 100 dollar damage, and 15% chance of incurring 150 dollar damage from a surge within the next two years. An inexpensive suppressor, which would provide protection for only one surge, can be purchased. How much should the owner be willing to pay if she makes decisions on the basis of expected value? Expected value =arrow_forwardQUESTION 4 4.1 Mrs Tintswalo Maila owns a metal press shop and is considering expanding her company to include an advanced machining process plant. If the plant is successful, her company could realise an additional R200 000. profit. If it fails she could incur a loss of R180 000. Tintswalo, being the eternal pessimist, estimates a 60% chance that the new plant will fail. Her other option is to build a pilot plant to help her decide whether to build a complete facility. The pilot plant would cost R10 000 to build and Tintswalo estimates that the pilot has a 50-50 chance of success. It the pilot plant is successful then there is a 90% likelihood that the full plant will also be successful. If the pilot plant is unsuccessful then there is a 20% probability that the full plant will also be unsuccessful. Tintswalo is faced with the problem of having to decide whether to build a full plant directly from the onset or to first build a pilot plant and based on its performance, decide whether…arrow_forward
- A manufacturer produces a toy sold during the summer season at a unit production cost of $5. The manufacturer sells the toy to a retailer, who then sells the product for $35 to the end customer. The manufacturer and retailer have agreed upon a revenue sharing contract that coordinates the supply chain and optimizes the expected profit of the entire supply chain (i.e., the retailer and the manufacturer), which is expected to be $4,000 over the summer selling season. If the wholesale price of the revenue sharing contract is $2, what is the manufacturer’s expected profit? PLEASE SHOW CALCULATIONSarrow_forwardA study was designed to assess the time to first exit-site infection (in months) in patients with renal insufficiency. In this study, 43 patients utilized a surgically placed catheter and 76 patients utilized a percutaneous placement of their catheter. See Section 1.4 (K&M) for more details. Data from this study is presented in Table 1.2. (a) Give a sensible formulation for the time-to-event problem in this study. Define the event of interest, time origin, and time scale. (b) What is the percentage of censored observations among patients whose catheter was placed surgically? (c) The investigators are interested in testing if there is a difference in the time to cutaneous exit-site infection between patients whose catheter was placed surgically and patients who had their catheters placed percutaneously. Do you think you can answer this question using a two-sample t-test? Provide justifications for your answer. answer a,b, & carrow_forwardThe SAT and ACT exams are often used to predict a student's first-term college grade point average (GPA). Different formulas are used for different colleges and majors. Suppose that a student is applying to a university with an intended major in civil engineering. Also suppose that for this college and this major, the following model is used to predict first term GPA. GPA = a + b(ACT) a = 0.6 b = 0.2 (a) In this context, what would be the appropriate interpretation of the value of a? The value of a is the predicted ACT score of a student who has a 0 GPA. There is not enough information to know how to interpret the value of a. The value of a represents the change in predicted GPA associated with an increase of 1 in ACT score. The value of a represents the change in predicted GPA associated with an decrease of 1 in ACT score. The value of a is the predicted GPA of a student who scored a 0 on the ACT. (b) In this context, what would be the…arrow_forward
 MATLAB: An Introduction with ApplicationsStatisticsISBN:9781119256830Author:Amos GilatPublisher:John Wiley & Sons Inc
 Probability and Statistics for Engineering and th...StatisticsISBN:9781305251809Author:Jay L. DevorePublisher:Cengage Learning
 Statistics for The Behavioral Sciences (MindTap C...StatisticsISBN:9781305504912Author:Frederick J Gravetter, Larry B. WallnauPublisher:Cengage Learning
 Elementary Statistics: Picturing the World (7th E...StatisticsISBN:9780134683416Author:Ron Larson, Betsy FarberPublisher:PEARSON
 The Basic Practice of StatisticsStatisticsISBN:9781319042578Author:David S. Moore, William I. Notz, Michael A. FlignerPublisher:W. H. Freeman
 Introduction to the Practice of StatisticsStatisticsISBN:9781319013387Author:David S. Moore, George P. McCabe, Bruce A. CraigPublisher:W. H. Freeman