
Elementary Statistics ( 3rd International Edition ) Isbn:9781260092561
3rd Edition
ISBN: 9781259969454
Author: William Navidi Prof.; Barry Monk Professor
Publisher: McGraw-Hill Education
expand_more
expand_more
format_list_bulleted
Concept explainers
Videos
Textbook Question
Chapter 2.4, Problem 7E
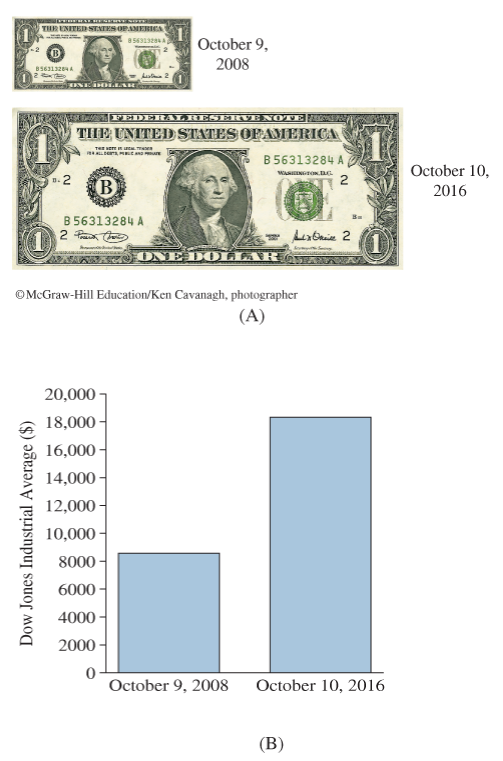
Stock market prices: The Dow Jones Industrial Average reached its lowest point in recent history on October 9, 2008, when it closed at $8,579. Eight years later, on October 10, 2016, the average had risen to $18,329.04. Which of the following graphs accurately represents the magnitude of the increase? Which one exaggerates it?
Expert Solution & Answer
Want to see the full answer?
Check out a sample textbook solution
Students have asked these similar questions
The bar graph below shows trends in several economic indicators over
the period 2004-2009. Over the six-year period, about what was the
highest consumer price index, and when did it occur?
Consumer Price Index
Percent change from previous year
3.5-
thu
-0.51
2004 2005 2006 2007 2008 2009
To the nearest tenth of a percent, the highest consumer price
index was%, and it occurred in the year.
You buy a new car for the price of $28,750 and, on average, that car’s value will depreciate by 18.25% each year. Use a graphing calculator to determine the time when your car’s value will be just $10,000 to the nearest year.
The following headline refers to change. Identify the change as absolute or relative.
“Another 22% tuition decrease is expected.”
Absolute changeRelative change
Chapter 2 Solutions
Elementary Statistics ( 3rd International Edition ) Isbn:9781260092561
Ch. 2.1 - In Exercises 5-8, fill in each blank with the...Ch. 2.1 - In Exercises 5-8, fill in each blank with the...Ch. 2.1 - In Exercises 5-8, fill in each blank with the...Ch. 2.1 - In Exercises 5-8, fill in each blank with the...Ch. 2.1 - In Exercises 9—12, determine whether the...Ch. 2.1 - In Exercises 9—12, determine whether the...Ch. 2.1 - In Exercises 9—12, determine whether the...Ch. 2.1 - In Exercises 9—12, determine whether the...Ch. 2.1 - The following bar graph presents the average...Ch. 2.1 - The most common blood typing system divides human...
Ch. 2.1 - Following is a pie chart that presents the...Ch. 2.1 - Government spending: The following pie chart...Ch. 2.1 - U.S. population: The following side-by-side bar...Ch. 2.1 - Super Bowl: The following side-by-side bar graph...Ch. 2.1 - Smartphone sales: The following frequency...Ch. 2.1 - Popular video games: The following frequency...Ch. 2.1 - More smartphones: Using the data in Exercise 19:...Ch. 2.1 - More video games: Using the data in Exercise 20:...Ch. 2.1 - Hospital admissions: The following frequency...Ch. 2.1 - World population: Following are the populations of...Ch. 2.1 - Ages of video garners: The Nielsen Company...Ch. 2.1 - How secure is your job? In a survey, employed...Ch. 2.1 - Back up your data: In a survey commissioned by the...Ch. 2.1 - Education levels: The following frequency...Ch. 2.1 - Twitter followers: The following frequency...Ch. 2.1 - Music sales: The following frequency distribution...Ch. 2.1 - Keeping up with the Kardashians: The following...Ch. 2.1 - Bought a new car lately? The following table...Ch. 2.1 - Bought a new- truck lately? The following table...Ch. 2.1 - Happy Halloween: The following table presents...Ch. 2.1 - Native languages: The following frequency...Ch. 2.1 - Proportion of females: Following are the...Ch. 2.2 - Prob. 5ECh. 2.2 - In Exercises 5—8, fill in each blank with the...Ch. 2.2 - In Exercises 5—8, fill in each blank with the...Ch. 2.2 - In Exercises 5—8, fill in each blank with the...Ch. 2.2 - In Exercises 9—12, determine whether the...Ch. 2.2 - In Exercises 9—12, determine whether the...Ch. 2.2 - In Exercises 9—12, determine whether the...Ch. 2.2 - In Exercises 9—12, determine whether the...Ch. 2.2 - In Exercises 13—16, classify the histogram as...Ch. 2.2 - In Exercises 13—16, classify the histogram as...Ch. 2.2 - In Exercises 13—16, classify the histogram as...Ch. 2.2 - In Exercises 13—16, classify the histogram as...Ch. 2.2 - In Exercises 17 and 18, classify the histogram as...Ch. 2.2 - In Exercises 17 and 18, classify the histogram as...Ch. 2.2 - Student heights: The following frequency histogram...Ch. 2.2 - Trained rats: Forty rats were trained to run a...Ch. 2.2 - Cholesterol: The following histogram shows the...Ch. 2.2 - Blood pressure: The following histogram shows the...Ch. 2.2 - Olympic athletes: The following frequency...Ch. 2.2 - Hows the weather? The following relative frequency...Ch. 2.2 - Skewed which way? For which of the following data...Ch. 2.2 - Skewed which way? For which of the following data...Ch. 2.2 - Batting average: The following frequency...Ch. 2.2 - Batting average: The following frequency...Ch. 2.2 - Time spent playing video games: A sample of 200...Ch. 2.2 - Murder, she wrote: The following frequency...Ch. 2.2 - BMW prices: The following table presents the...Ch. 2.2 - Geysers: The geyser Old Faithful in Yellowstone...Ch. 2.2 - Hail to the chief: There have been 58 presidential...Ch. 2.2 - Internet radio: The following table presents the...Ch. 2.2 - Brothers and sisters: Thirty students in a...Ch. 2.2 - Cough, cough: The following table presents the...Ch. 2.2 - Prob. 37ECh. 2.2 - Prob. 38ECh. 2.2 - Prob. 39ECh. 2.2 - Prob. 40ECh. 2.2 - Frequency polygon: Using the data in Exercise 29:...Ch. 2.2 - Prob. 42ECh. 2.2 - Ogive: Using the data in Exercise 27: Compute the...Ch. 2.2 - Ogive: Using the data in Exercise 28: Compute the...Ch. 2.2 - Ogive: Using the data in Exercise 29: Compute the...Ch. 2.2 - Prob. 46ECh. 2.2 - Prob. 47ECh. 2.2 - Prob. 48ECh. 2.2 - Prob. 49ECh. 2.2 - Prob. 50ECh. 2.2 - Prob. 51ECh. 2.2 - Prob. 52ECh. 2.2 - Frequencies and relative frequencies: The...Ch. 2.3 - In Exercises 3—6, fill in each blank with the...Ch. 2.3 - In Exercises 3—6, fill in each blank with the...Ch. 2.3 - In Exercises 3—6, fill in each blank with the...Ch. 2.3 - In Exercises 3—6, fill in each blank with the...Ch. 2.3 - Prob. 7ECh. 2.3 - In Exercises 7—10, determine whether the...Ch. 2.3 - In Exercises 7—10, determine whether the...Ch. 2.3 - In Exercises 7—10, determine whether the...Ch. 2.3 - Construct a stem-and-leaf plot for the following...Ch. 2.3 - Construct a stem-and-leaf plot for the following...Ch. 2.3 - List the data in the following stem-and-leaf plot....Ch. 2.3 - List the data in the following stein-and-leaf...Ch. 2.3 - Construct a dotplot for the data in Exercise 11.Ch. 2.3 - Prob. 16ECh. 2.3 - BMW prices: The following table presents the...Ch. 2.3 - Hows the weather? The following table presents the...Ch. 2.3 - Air pollution: The following table presents...Ch. 2.3 - Technology salaries: The following table presents...Ch. 2.3 - Tennis and golf: Following are the ages of the...Ch. 2.3 - Pass the popcorn: Following are the running times...Ch. 2.3 - More weather: Construct a dotplot for the data in...Ch. 2.3 - Prob. 24ECh. 2.3 - Looking for a job: The following table presents...Ch. 2.3 - Prob. 26ECh. 2.3 - Military spending: The following table presents...Ch. 2.3 - Prob. 28ECh. 2.3 - Dining out: The following time-series plot...Ch. 2.3 - Prob. 30ECh. 2.3 - Prob. 31ECh. 2.3 - More gold: The following time series plot presents...Ch. 2.3 - Prob. 33ECh. 2.3 - Prob. 34ECh. 2.3 - Vote: The following time-series plot presents the...Ch. 2.3 - Arctic ice sheet: The following table presents the...Ch. 2.3 - Prob. 37ECh. 2.4 - In Exercises 3 and 4, fill in each blank with the...Ch. 2.4 - In Exercises 3 and 4, fill in each blank with the...Ch. 2.4 - CD sales decline: Sales of CDs have been declining...Ch. 2.4 - Music sales: The following time-series plot and...Ch. 2.4 - Stock market prices: The Dow Jones Industrial...Ch. 2.4 - Save your money: In 2007, U.S. residents saved...Ch. 2.4 - Ill take mine with mustard: The following bar...Ch. 2.4 - Stream or download? The following bar graph...Ch. 2.4 - Female senators: Of the 100 members of the United...Ch. 2.4 - Age at marriage: Data compiled by the U.S. Census...Ch. 2.4 - College degrees: Both of the following time-series...Ch. 2.4 - Food expenditures: Both of the following...Ch. 2.4 - Prob. 15ECh. 2 - Following is the list of letter grades for...Ch. 2 - Prob. 2CQCh. 2 - Construct a frequency bar graph for the data in...Ch. 2 - Prob. 4CQCh. 2 - Prob. 5CQCh. 2 - Prob. 6CQCh. 2 - Prob. 7CQCh. 2 - Prob. 8CQCh. 2 - Prob. 9CQCh. 2 - Prob. 10CQCh. 2 - Following are the prices (in dollars) for a sample...Ch. 2 - Prob. 12CQCh. 2 - Prob. 13CQCh. 2 - Prob. 14CQCh. 2 - Prob. 15CQCh. 2 - Trust your doctor: The General Social Survey...Ch. 2 - Internet browsers: The following relative...Ch. 2 - Prob. 3RECh. 2 - Prob. 4RECh. 2 - Prob. 5RECh. 2 - House freshmen: Newly elected members of the U.S....Ch. 2 - More freshmen: For the data in Exercise 6:...Ch. 2 - Royalty: Following are the ages at death for all...Ch. 2 - Prob. 9RECh. 2 - Prob. 10RECh. 2 - Prob. 11RECh. 2 - Prob. 12RECh. 2 - Prob. 13RECh. 2 - Prob. 14RECh. 2 - Prob. 15RECh. 2 - Explain why the frequency bar graph and the...Ch. 2 - Prob. 2WAICh. 2 - Prob. 3WAICh. 2 - Prob. 4WAICh. 2 - Prob. 5WAICh. 2 - In the chapter introduction, we presented gas...Ch. 2 - In the chapter introduction, we presented gas...Ch. 2 - In the chapter introduction, we presented gas...Ch. 2 - Prob. 4CSCh. 2 - In the chapter introduction, we presented gas...Ch. 2 - Prob. 6CSCh. 2 - In the chapter introduction, we presented gas...Ch. 2 - Prob. 8CSCh. 2 - In the chapter introduction, we presented gas...
Knowledge Booster


Learn more about
Need a deep-dive on the concept behind this application? Look no further. Learn more about this topic, statistics and related others by exploring similar questions and additional content below.Similar questions
- In Example 11, during which year did the sales reach $180 billion?arrow_forwardTotal spending on health care in a certain region rose from $881 million in 1977 to $941 billion in 2007. Compare this rise in health care spending to the overall rate of inflation as measured by the Consumer Price Index. Click the icon to view the Average Annual Consumer Price Index. Health care spending increased by %. (Round to the nearest percent as needed.) Average Annual Consumer Price Index (1982-1984-100 Year CPI Year CPI Year CPI 1976 56.9 1987 113.6 1998 163.0 166.6 1977 60.6 1988 118.3 1999 1978 65.2 1989 124.0 2000 172.2 130.7 136.2 2001 2002 1979 72.6 1990 177.1 1980 1981 82.4 1991 179.9 140.3 2003 2004 90.9 1992 184.0 144.5 148.2 188.9 195.3 201.6 1982 96.5 1993 99.6 103.9 2005 2006 1983 1994 1984 1995 152.4 2007 207.3 2008 215.3 1996 156.9 107.6 109.6 1985 1986 1997 160.5 Print Done Enter your answer in the answer box and then click Check Answer.arrow_forwardThe bar graph below shows trends in several economic indicators over the period 1994 - 1999. Over the six-year period, about what was the highest consumer price index, and when did it occur? Consumer Price Index Percent change from previous year 4 3.5- 0- -0.5- L 1994 1995 1996 1997 1998 1999 (・・・) To the nearest tenth of a percent, the highest consumer price index was %, and it occurred in the year.arrow_forward
- A teller's hourly wage for various years is represented in the table below. Year Hourly Wage 2015 $22.50 2016 $24.00 2017 $27.60 What was the hourly wage percent of change from 2016 to 2017? Be sure to state if it was a percent increase or percent decrease. %arrow_forwardThe bar graph shows the average price of new cars in the United Statesand the average age of cars on U.S. roads for two selected years.In 2014, the average price of a new car was $37,600. For the period shown, new-car prices increased by approximately $1250 per year. If this trend continues, how many years after 2014 will the price of a new car average $46,350? In which yearwill this occur?arrow_forwardA principal amount of $5,000 is placed in a savings account with 5% annual interest compounded quarterly. Part A: List the total account balances for years 0 through 4. Part B: Which type of function best models the data?arrow_forward
- Total spending on health care in a certain region rose from $42 billion in 1976 to $2.9 trillion in 2006. Compare this rise in health care spending to the overall rate of inflation as measured by the Consumer Price Index. Click the icon to view the Average Annual Consumer Price Index. Health care spending increased by %. (Round to the nearest percent as needed.) i Average Annual Consumer Price Index (1982-1984=100 Year Year Year CPI CPI CPI 1976 56.9 1987 113.6 1998 163.0 60.6 166.6 1977 1988 118.3 1999 65.2 124.0 1978 1989 2000 172.2 1979 2001 72.6 1990 130.7 177.1 136.2 1980 2002 82.4 1991 179.9 1981 2003 90.9 1992 140.3 184.0 1982 188.9 96.5 1993 144.5 2004 2005 1983 99.6 1994 148.2 195.3 1984 103.9 2006 1995 152.4 201.6 107.6 2007 1985 1996 156.9 207.3 1997 160.5 2008 1986 109.6 215.3 Print Donearrow_forwardTotal spending on health care in a certain region rose from $937 million in 1976 to $946 billion in 2007. Compare this rise in health care spending to the overall rate of inflation as measured by the Consumer Price Index. Click the icon to view the Average Annual Consumer Price Index. Health care spending increased by %. (Round to the nearest percent as needed.) The overall rate of inflation was %. i Average Annual Consumer Price Index (1982-1984=100 A (Round to the nearest percent as needed.) Year CPI Year CPI Year CPI 1976 163.0 166.6 56.9 1987 113.6 118.3 1998 1999 1977 6076 652 1988 1978 1989 124.0 2000 172.2 1979 1980 1981 72.6 82.4 90.9 1990 130.7 2001 177.1 1991 136.2 2002 179.9 184.0 188.9 195.3 1992 140.3 2003 2004 2005 1982 96.5 1993 144.5 1983 1984 99.6 1994 148.2 103.9 1995 152.4 2006 201.6 156.9 160.5 2007 2008 1985 107.6 1996 207.3 1986 109.6 1997 215.3 Print Donearrow_forwardGiven the statement: In 6 trading days, the stock price rose $29.59. How rapidly, on average, has the stock price changed on a daily basis?arrow_forward
arrow_back_ios
arrow_forward_ios
Recommended textbooks for you

 College Algebra (MindTap Course List)AlgebraISBN:9781305652231Author:R. David Gustafson, Jeff HughesPublisher:Cengage Learning
 College AlgebraAlgebraISBN:9781305115545Author:James Stewart, Lothar Redlin, Saleem WatsonPublisher:Cengage Learning
 Big Ideas Math A Bridge To Success Algebra 1: Stu...AlgebraISBN:9781680331141Author:HOUGHTON MIFFLIN HARCOURTPublisher:Houghton Mifflin Harcourt
 Glencoe Algebra 1, Student Edition, 9780079039897...AlgebraISBN:9780079039897Author:CarterPublisher:McGraw Hill
 Trigonometry (MindTap Course List)TrigonometryISBN:9781337278461Author:Ron LarsonPublisher:Cengage Learning
College Algebra (MindTap Course List)
Algebra
ISBN:9781305652231
Author:R. David Gustafson, Jeff Hughes
Publisher:Cengage Learning
College Algebra
Algebra
ISBN:9781305115545
Author:James Stewart, Lothar Redlin, Saleem Watson
Publisher:Cengage Learning
Big Ideas Math A Bridge To Success Algebra 1: Stu...
Algebra
ISBN:9781680331141
Author:HOUGHTON MIFFLIN HARCOURT
Publisher:Houghton Mifflin Harcourt
Glencoe Algebra 1, Student Edition, 9780079039897...
Algebra
ISBN:9780079039897
Author:Carter
Publisher:McGraw Hill
Trigonometry (MindTap Course List)
Trigonometry
ISBN:9781337278461
Author:Ron Larson
Publisher:Cengage Learning
What is a Linear Equation in One Variable?; Author: Don't Memorise;https://www.youtube.com/watch?v=lDOYdBgtnjY;License: Standard YouTube License, CC-BY
Linear Equation | Solving Linear Equations | What is Linear Equation in one variable ?; Author: Najam Academy;https://www.youtube.com/watch?v=tHm3X_Ta_iE;License: Standard YouTube License, CC-BY