
Videos
Refer to Exercise 9.17. Conduct a two-sample t-test (Section 8.2) of the null hypothesis that the two treatment means are equal for each dot plot. Use α = .05 and two-tailed tests. In the course of the test, compare each of the following with the F-tests in Exercise 9.17:
- a. The pooled variances and the MSEs
- b. The t- and F-test statistics
- c. The tabled values of t and F that determine the rejection regions
- d. The conclusions of the t- and F-tests
- e. The assumptions that must be made to ensure the validity of the t- and F-tests
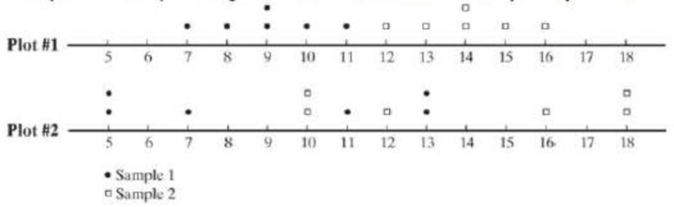
9.17 Consider dot plots 1 and 2 shown below. Assume that the two samples represent independent, random samples corresponding to two treatments in a completely randomized design.
Want to see the full answer?
Check out a sample textbook solution
Chapter 9 Solutions
Statistics for Business and Economics (13th Edition)
Additional Math Textbook Solutions
Elementary Statistics
Statistical Techniques in Business and Economics
Elementary Statistics Using the TI-83/84 Plus Calculator, Books a la Carte Edition (4th Edition)
Elementary Statistics (13th Edition)
Statistics for Business & Economics, Revised (MindTap Course List)
Elementary Statistics Using Excel (6th Edition)


 Calculus For The Life SciencesCalculusISBN:9780321964038Author:GREENWELL, Raymond N., RITCHEY, Nathan P., Lial, Margaret L.Publisher:Pearson Addison Wesley,
 Glencoe Algebra 1, Student Edition, 9780079039897...AlgebraISBN:9780079039897Author:CarterPublisher:McGraw Hill