
Introductory Statistics (10th Edition)
10th Edition
ISBN: 9780321989178
Author: Neil A. Weiss
Publisher: PEARSON
expand_more
expand_more
format_list_bulleted
Concept explainers
Videos
Textbook Question
Chapter 14.2, Problem 50E
In each of Exercises 14.48–14.57,
- a. find the regression equation for the data points. Use the defining formulas in Definition 14.4 to obtain Sxx and Sxy.
- b. graph the regression equation and the data points.
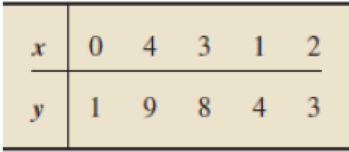
14.50
Expert Solution & Answer
Want to see the full answer?
Check out a sample textbook solution
Students have asked these similar questions
Using the data in Table 6–11, answer the following:a. What is the slope?b. What is the intercept?c. Write the regression equation.d. Calculate a regression forecast for month 25.
-Using the data in Table 6–11, answer the following:
What is the slope?
What is the intercept?
Write the regression equation.
Calculate a regression forecast for month 25.
Applying the Concepts and SkillsIn Exercises, we repeat the information from Exercises. For each exercise here, discuss what satisfying Assumptions 1–3 for regression inferences by the variables under consideration would mean.ExercisesApplying the Concepts and SkillsIn each of Exercises,a. find the regression equation for the data points.b. graph the regression equation and the data points.c. describe the apparent relationship between the two variables under consideration.d. interpret the slope of the regression line.e. identify the predictor and response variables.f. identify outliers and potential influential observations.g. predict the values of the response variable for the specified values of the predictor variable, and interpret your results.Tax Efficiency.Tax efficiency is a measure, ranging from 0 to 100, of how much tax due to capital gains stock or mutual funds investors pay on their investments each year; the higher the tax efficiency, the lower is the tax. In the article…
Chapter 14 Solutions
Introductory Statistics (10th Edition)
Ch. 14.1 - Regarding linear equations with one independent...Ch. 14.1 - Prob. 2ECh. 14.1 - Consider the linear equation y = b0 + b1x. a....Ch. 14.1 - Prob. 4ECh. 14.1 - In Exercises 14.514.14, we give linear equations....Ch. 14.1 - Prob. 6ECh. 14.1 - In Exercises 14.5-14.14, we give linear equations....Ch. 14.1 - Prob. 8ECh. 14.1 - Prob. 9ECh. 14.1 - In Exercises 14.514.14, we give linear equations....
Ch. 14.1 - Prob. 11ECh. 14.1 - Prob. 12ECh. 14.1 - Prob. 13ECh. 14.1 - Prob. 14ECh. 14.1 - In Exercises 14.1514.22,we identify the...Ch. 14.1 - Prob. 16ECh. 14.1 - Prob. 17ECh. 14.1 - Prob. 18ECh. 14.1 - Prob. 19ECh. 14.1 - Prob. 20ECh. 14.1 - Prob. 21ECh. 14.1 - Prob. 22ECh. 14.1 - Rental-Car Costs. During one month, the Avis...Ch. 14.1 - Air-Conditioning Repairs. Richards Healing and...Ch. 14.1 - Measuring Temperature. The two most commonly used...Ch. 14.1 - A Law of Physics. A ball is thrown straight up in...Ch. 14.1 - Prob. 27ECh. 14.1 - Prob. 28ECh. 14.1 - Prob. 29ECh. 14.1 - Prob. 30ECh. 14.1 - Prob. 31ECh. 14.1 - Road Grade. The grade of a road is defined as the...Ch. 14.1 - Vertical Lines. In this section, we stated that...Ch. 14.2 - Regarding a scatterplot, a. identify one of its...Ch. 14.2 - Regarding the criterion used to decide on the line...Ch. 14.2 - Regarding the line that best fits a set of data...Ch. 14.2 - Regarding the two variables under consideration in...Ch. 14.2 - Using the regression equation to make predictions...Ch. 14.2 - Fill in the blanks. a. In the context of...Ch. 14.2 - For which of the following sets of data points can...Ch. 14.2 - For which of the following sets of data points can...Ch. 14.2 - In each of Exercises 14.4214.45, we have presented...Ch. 14.2 - In each of Exercises 14.4214.45, we have presented...Ch. 14.2 - In each of Exercises 14.4214.45, we have presented...Ch. 14.2 - In each of Exercises 14.4214.45, we have presented...Ch. 14.2 - For a data set consisting of two data points: a....Ch. 14.2 - Prob. 47ECh. 14.2 - In each of Exercises 14.4814.57, a. find the...Ch. 14.2 - In each of Exercises 14.4814.57. a. find the...Ch. 14.2 - In each of Exercises 14.4814.57, a. find the...Ch. 14.2 - In each of Exercises 14.48-14.57, a. find the...Ch. 14.2 - In each of Exercises 14.4814.57, a. find the...Ch. 14.2 - In each of Exercises 14.4814.57, a. find the...Ch. 14.2 - In each of Exercises 14.48-14.57, a. find the...Ch. 14.2 - In each of Exercises 14.4814.57. a. find the...Ch. 14.2 - In each of Exercises 14.4814.57. a. find the...Ch. 14.2 - In each of Exercises 14.4814.57. a. find the...Ch. 14.2 - Prob. 58ECh. 14.2 - In each of Exercises 14.5814.63, a. find the...Ch. 14.2 - In each of Exercises 14.5814.63. a. find the...Ch. 14.2 - In each of Exercises 14.5814.63, a. find the...Ch. 14.2 - In each of Exercises 14.5814.63. a. find the...Ch. 14.2 - In each of Exercises 14.5814.63, a. find the...Ch. 14.2 - Tax Efficiency. In Exercise 14.58, you determined...Ch. 14.2 - Corvette Prices. In Exercise 14.59, you determined...Ch. 14.2 - Anscombes Quartet. In the article Graphs in...Ch. 14.2 - Study Time and Score. The negative relation...Ch. 14.2 - Age and Price of Orions. In Table 14.2, we...Ch. 14.2 - Wasp Mating Systems. In the paper "Mating System...Ch. 14.2 - In Exercises 14.7014.80, use the technology of...Ch. 14.2 - In Exercises 14.7014.80, use the technology of...Ch. 14.2 - In Exercises 14.7014.80, use the technology of...Ch. 14.2 - In Exercises I4.7014.80, use the technology of...Ch. 14.2 - In Exercises 14.7014.80, use the technology of...Ch. 14.2 - In Exercises 14.7014.80, use the technology of...Ch. 14.2 - Prob. 76ECh. 14.2 - Prob. 77ECh. 14.2 - Prob. 78ECh. 14.2 - Prob. 79ECh. 14.2 - In Exercises 14.7014.80, use the technology of...Ch. 14.2 - Prob. 81ECh. 14.2 - Time Series. A collection of observations of a...Ch. 14.3 - In this section, we introduced a descriptive...Ch. 14.3 - A measure of total variation in the observed...Ch. 14.3 - A measure of the amount of variation in the...Ch. 14.3 - A measure of the amount of variation in the...Ch. 14.3 - Prob. 87ECh. 14.3 - In Exercises 14.8814.97, we repeal the data and...Ch. 14.3 - In Exercises14.481497, we repeal the tiara and...Ch. 14.3 - In Exercises 14.8814.97, we repeat the data and...Ch. 14.3 - Prob. 91ECh. 14.3 - Prob. 92ECh. 14.3 - Prob. 93ECh. 14.3 - Prob. 94ECh. 14.3 - Prob. 95ECh. 14.3 - Prob. 96ECh. 14.3 - Prob. 97ECh. 14.3 - Applying the Concepts and Skills For Exercises...Ch. 14.3 - Prob. 99ECh. 14.3 - Prob. 100ECh. 14.3 - Prob. 101ECh. 14.3 - Prob. 102ECh. 14.3 - For Exercises 14.9814.103, a. compute SST, SSR,...Ch. 14.3 - Prob. 104ECh. 14.3 - In Exercises 14.10414.115, use the technology of...Ch. 14.3 - Prob. 106ECh. 14.3 - Prob. 107ECh. 14.3 - Prob. 108ECh. 14.3 - Prob. 109ECh. 14.3 - Prob. 110ECh. 14.3 - Prob. 111ECh. 14.3 - Prob. 112ECh. 14.3 - Prob. 113ECh. 14.3 - In Exercises 14.10414.115, use the technology of...Ch. 14.3 - In Exercises 14.10414.115, use the technology of...Ch. 14.3 - What can you say about SSE, SSR, and the utility...Ch. 14.3 - As we noted, because of the regression identity,...Ch. 14.4 - What is one purpose of the linear correlation...Ch. 14.4 - Prob. 119ECh. 14.4 - The symbol that is used for the linear correlation...Ch. 14.4 - A value of r close to 1 indicates that there is a...Ch. 14.4 - A value of r close to ____ indicates that there is...Ch. 14.4 - A value of r close to ____ indicates that the...Ch. 14.4 - A value of r close to 0 indicates that the...Ch. 14.4 - If y tends to increase linearly as x increases,...Ch. 14.4 - If y lends to decrease linearly as x increases,...Ch. 14.4 - If there is no linear relationship between x and...Ch. 14.4 - In each of Exercises 14.12814.130, determine...Ch. 14.4 - In each of Exercises 14.12814.130, determine...Ch. 14.4 - In each of Exercises 14.12814.130, determine...Ch. 14.4 - Answer true or false to the following statement...Ch. 14.4 - The linear correlation coefficient of a set of...Ch. 14.4 - The coefficient of determination of a set of data...Ch. 14.4 - In Exercises 14.13414.143, we repeat data from...Ch. 14.4 - In Exercises 14.13414.143, we repeat data from...Ch. 14.4 - In Exercises 14.13414.143, we repeat data front...Ch. 14.4 - Prob. 137ECh. 14.4 - In Exercises 14.13414.143, we repeat data from...Ch. 14.4 - In Exercises 14.13414.143, we repeat data from...Ch. 14.4 - In Exercises 14.13414.143, we repeat data from...Ch. 14.4 - In Exercises 14.13414.143, we repeat data from...Ch. 14.4 - In Exercises 14.13414.143, we repeat data from...Ch. 14.4 - In Exercises 14.13414.143, we repeat data from...Ch. 14.4 - In Exercises 14.14414.149, we repeat data from...Ch. 14.4 - In Exercises 14.14414.149, we repeat data from...Ch. 14.4 - In Exercises 14.14414.149, we repeat data from...Ch. 14.4 - Prob. 147ECh. 14.4 - In Exercises 14.14414.149, we repeat data from...Ch. 14.4 - In Exercises 14.14414.149, we repeat data from...Ch. 14.4 - Height and Score. A random sample of 10 students...Ch. 14.4 - Prob. 151ECh. 14.4 - Prob. 152ECh. 14.4 - Prob. 153ECh. 14.4 - Prob. 154ECh. 14.4 - In Exercise 14.154-14.166, use the technology of...Ch. 14.4 - Prob. 156ECh. 14.4 - Prob. 157ECh. 14.4 - Prob. 158ECh. 14.4 - Prob. 159ECh. 14.4 - Prob. 160ECh. 14.4 - Prob. 161ECh. 14.4 - In Exercises 14.154-14.166, use the technology of...Ch. 14.4 - In Exercises 14.15414.166, use the technology of...Ch. 14.4 - Prob. 164ECh. 14.4 - Prob. 165ECh. 14.4 - In Exercises 14.154-14.166, use the technology of...Ch. 14.4 - The coefficient of determination of a set of data...Ch. 14.4 - Country Music Blues. A Knight-Ridder News Service...Ch. 14.4 - Prob. 169ECh. 14.4 - In each of Exercises 14.169 and 14.170, a....Ch. 14 - For a linear equation y = b0 + b1x, identify the ...Ch. 14 - Consider the linear equation y = 4-3x. a. At what...Ch. 14 - In Problems 35, answer true or false to each...Ch. 14 - In Problems 35, answer true or false to each...Ch. 14 - In Problems 35, answer true or false to each...Ch. 14 - Prob. 6RPCh. 14 - In Problems 35, answer true or false to each...Ch. 14 - Prob. 8RPCh. 14 - In each of Problems 911, fill in the blank. 9....Ch. 14 - Prob. 10RPCh. 14 - Prob. 11RPCh. 14 - Prob. 12RPCh. 14 - Prob. 13RPCh. 14 - Prob. 14RPCh. 14 - Prob. 15RPCh. 14 - Prob. 16RPCh. 14 - Prob. 17RPCh. 14 - Prob. 18RPCh. 14 - Prob. 19RPCh. 14 - Equipment Depreciation. A small company has...Ch. 14 - Graduation Rates. Graduation ratethe percentage of...Ch. 14 - Graduation Rates. Refer to Problem 21. a....Ch. 14 - Graduation Rates. Refer to Problem 21. a. Compute...Ch. 14 - Exotic Plants. In the article Effects of Human...Ch. 14 - In Problems 2527, use the technology of your...Ch. 14 - Prob. 26RPCh. 14 - Prob. 27RPCh. 14 - Recall from Chapter 1 (see page 34) that the Focus...Ch. 14 - At the beginning of this chapter, we presented...
Knowledge Booster


Learn more about
Need a deep-dive on the concept behind this application? Look no further. Learn more about this topic, statistics and related others by exploring similar questions and additional content below.Similar questions
- Sam Jones has 2 years of historical sales data for his company. He is applyingfor a business loan and must supply his projections of sales by month for thenext 2 years to the bank. a. Using the data from Table 6–12, provide a regression forecast for timeperiods 25 through 48.b. Does Sam’s sales data show a seasonal pattern?arrow_forwardThe table gives the average heights of children for ages 1 – 10, where x = the age (in years) and y = the height (in cm). Part a: Make a scatter plot and determine which type of model best fits the data.Part b: Find the regression equation.Part c: Can your equation be used to find the average height of a 20 year old? Explain.arrow_forwardWorld Military Expenditure The following chart shows total military and arms trade expenditure from 2011–2020 (t = 1 represents 2011). †A bar graph titled "World military expenditure" has a horizontal t-axis labeled "Year since 2010" and a vertical axis labeled "$ (billions)". The bar graph has 10 bars. Each bar is associated with a label and an approximate value as listed below. 1: 1,800 billion dollars 2: 1,775 billion dollars 3: 1,750 billion dollars 4: 1,730 billion dollars 5: 1,760 billion dollars 6: 1,760 billion dollars 7: 1,850 billion dollars 8: 1,900 billion dollars 9: 1,950 billion dollars 10: 1,980 billion dollars (a) If you want to model the expenditure figures with a function of the form f(t) = at2 + bt + c, would you expect the coefficient a to be positive or negative? Why? HINT [See "Features of a Parabola" in this section.] We would expect the coefficient to be positive because the curve is concave up. We would expect the coefficient to be negative because the…arrow_forward
- For Exercises 49–52, rewrite the equation so that the coefficient on x is positive.arrow_forwardRegression and Predictions. Exercises 13–28 use the same data sets as Exercises 13–28 in Section 10-1. In each case, find the regression equation, letting the first variable be the predictor (x) variable. Find the indicated predicted value by following the prediction procedure summarized in Figure 10-5 on page 493. Tips Using the bill/tip data, find the best predicted tip amount for a dinner bill of $100. What tipping rule does the regression equation suggest?arrow_forwardproblen 1.2arrow_forward
- Insurance Rates The following table gives themonthly insurance rates for a $100,000 life insurancepolicy for smokers 35–50 years of age.a. Create a scatter plot for the data.b. Does it appear that a quadratic function can beused to model the data? If so, find the best-fittingquadratic model.c. Find the power model that is the best fit for the data.d. Compare the two models by graphing each modelon the same axes with the data points. Whichmodel appears to be the better fit?arrow_forwardRegression and Predictions. Exercises 13–28 use the same data sets as Exercises 13–28 in Section 10-1. In each case, find the regression equation, letting the first variable be the predictor (x) variable. Find the indicated predicted value by following the prediction procedure summarized in Figure 10-5 on page 493. Crickets and Temperature Find the best predicted temperature at a time when a cricket chirps 3000 times in 1 minute. What is wrong with this predicted temperature?arrow_forwardRegression and Predictions. Exercises 13–28 use the same data sets as Exercises 13–28 in Section 10-1. In each case, find the regression equation, letting the first variable be the predictor (x) variable. Find the indicated predicted value by following the prediction procedure summarized in Figure 10-5 on page 493. Oscars Using the listed actress/actor ages, find the best predicted age of the Best Actor given that the age of the Best Actress is 54 years. Is the result reasonably close to the Best Actor’s (Eddie Redmayne) actual age of 33 years, which happened in 2015, when the Best Actress was Julianne Moore, who was 54 years of age?arrow_forward
- U.S. Population The number of White non-Hispanicindividuals in the U.S. civilian non-institutional population 16 years and older was 153.1 million in 2000and is projected to be 169.4 million in 2050.(Source: U.S. Census Bureau)a. Find the average annual rate of change in population during the period 2000–2050, with the appropriate units.b. Use the slope from part (a) and the population in2000 to write the equation of the line associatedwith 2000 and 2050.c. What does this model project the population to bein 2020?arrow_forwardHelp with #6.27 please.arrow_forwardDoes the regression equation Y = - 105 - 10X prove that a change in X causes a change in Y. Select one: Oa. Either A or B O b. Neither A nor B Oc. True O d. Falsearrow_forward
arrow_back_ios
SEE MORE QUESTIONS
arrow_forward_ios
Recommended textbooks for you
 Algebra & Trigonometry with Analytic GeometryAlgebraISBN:9781133382119Author:SwokowskiPublisher:Cengage
Algebra & Trigonometry with Analytic Geometry
Algebra
ISBN:9781133382119
Author:Swokowski
Publisher:Cengage
Correlation Vs Regression: Difference Between them with definition & Comparison Chart; Author: Key Differences;https://www.youtube.com/watch?v=Ou2QGSJVd0U;License: Standard YouTube License, CC-BY
Correlation and Regression: Concepts with Illustrative examples; Author: LEARN & APPLY : Lean and Six Sigma;https://www.youtube.com/watch?v=xTpHD5WLuoA;License: Standard YouTube License, CC-BY