
Concept explainers
Videos
In each of Exercises 14.58–14.63,
- a. find the regression equation for the data points.
- b. graph the regression equation and the data points.
- c. describe the apparent relationship between the two variables under consideration.
- d. interpret the slope of the regression line.
- e. identify the predictor and response variables.
- f. identify outliers and potential influential observations.
- g. predict the values of the response variable for the specified values of the predictor variable, and interpret your results.
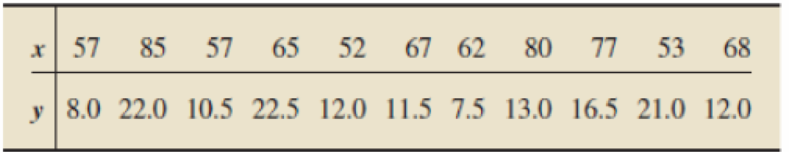
14.61 Plant Emissions. Plants emit gases that trigger the ripening of fruit, attract pollinators, and cue other physiological responses. N. Agelopolous et al. examined factors that affect the emission of volatile compounds by the potato plant Solanum tuberosum and published their findings in the paper “Factors Affecting Volatile Emissions of Intact Potato Plants, Solanum tuberosum: Variability of Quantities and Stability of Ratios” (Journal of Chemical Ecology, Vol. 26, No. 2, pp. 497–511). The volatile compounds analyzed were hydrocarbons used by other plants and animals. Following are data on plant weight (X), in grams, and quantity of volatile compounds emitted (y), in hundreds of nanograms, for 11 potato plants. For pan (g), predict the quantity of volatile compounds emitted by a potato plant that weighs 75 grams.
Want to see the full answer?
Check out a sample textbook solution
Chapter 14 Solutions
Introductory Statistics (10th Edition)


- Does Table 1 represent a linear function? If so, finda linear equation that models the data.arrow_forwardApplying the Concepts and SkillsIn Exercises, we repeat the information from Exercises. For each exercise here, discuss what satisfying Assumptions 1–3 for regression inferences by the variables under consideration would mean.ExercisesApplying the Concepts and SkillsIn each of Exercises,a. find the regression equation for the data points.b. graph the regression equation and the data points.c. describe the apparent relationship between the two variables under consideration.d. interpret the slope of the regression line.e. identify the predictor and response variables.f. identify outliers and potential influential observations.g. predict the values of the response variable for the specified values of the predictor variable, and interpret your results.Tax Efficiency.Tax efficiency is a measure, ranging from 0 to 100, of how much tax due to capital gains stock or mutual funds investors pay on their investments each year; the higher the tax efficiency, the lower is the tax. In the article…arrow_forwardSam Jones has 2 years of historical sales data for his company. He is applyingfor a business loan and must supply his projections of sales by month for thenext 2 years to the bank. a. Using the data from Table 6–12, provide a regression forecast for timeperiods 25 through 48.b. Does Sam’s sales data show a seasonal pattern?arrow_forward
- a. Write out the estimated linear regression equation. b. What is the estimated expected weight of an alligator that has snout Length=36 inches?arrow_forwarda. Write out the estimated linear regression equation. b. What is the estimated expected weight of an alligator that has snout Length=36 inches? c. Does the intercept have a useful interpretation in this study? Why or why not.arrow_forwardRefer to the data set:Part a: Make a scatter plot and determine which type of model best fits the data.Part b: Find the regression equation.Part c: Use the equation from Part b to determine y when x = 5.arrow_forward
- It is a model that shows or predict the relationship between two variables. A. Linear Regression B. Correlation Coefficient C. Statistics D. Cryptographyarrow_forwardQ2) Convert the data in table below into information using regression approach. X 1 2 3 4 5 6 Y 6 1 9 5 17 12arrow_forwardQ1) Interpret the following regression line y = 10.50 – 0.18xarrow_forward
- Population Expenditure 29 435 86 1090 219 503 47 3524 185 98 952 89 127 214 133 208 153 184 130 217 141 154 194 103arrow_forwardA. Write the equation of the regression line. B. Interpret each one of the slopes in this context. C. Calculate the estimated number of days absent and the residual for the first observation in the data set: a student who is aboriginal, male, a slow learner, and missed 2 days of school.arrow_forwarda. Draw a scatter diagram for the data. b. Draw a regression line of y on x. c. Determine the equation of the line of best fit.arrow_forward
 Calculus For The Life SciencesCalculusISBN:9780321964038Author:GREENWELL, Raymond N., RITCHEY, Nathan P., Lial, Margaret L.Publisher:Pearson Addison Wesley,
 Algebra & Trigonometry with Analytic GeometryAlgebraISBN:9781133382119Author:SwokowskiPublisher:Cengage
 Glencoe Algebra 1, Student Edition, 9780079039897...AlgebraISBN:9780079039897Author:CarterPublisher:McGraw Hill
 Trigonometry (MindTap Course List)TrigonometryISBN:9781337278461Author:Ron LarsonPublisher:Cengage Learning